Market Wrap: Stocks, Bonds, Commodities
Wall Street ended lower on Tuesday after data showed producer prices increased more than expected in November, solidifying expectations the Federal Reserve this week will announce a faster wind-down of asset purchases.
The Dow Jones Industrial Average fell 0.3% to end at 35,544.18 points, while the S&P 500 lost 0.75% to 4,634.09. The Nasdaq Composite dropped 1.14% to 15,237.64.
MSCI’s index of Asia-Pacific stocks outside Japan slipped 0.22% to 783.96 levels. Australian index fell 0.70% to 7,327.10. Japanese Nikkei Index rose 0.10% to 28,459.72.
European stocks were higher on Wednesday, with the Stoxx Europe 50 Index rising 0.62% to 4,169.25, Germany’s DAX gaining 0.39% to 15,513.57, and France’s CAC advances 0.69% to 6,943.15, and U.K.’s FTSE 100 fell 0.22% to 7,203.29.
Benchmark 10-year U.S. Treasury rose as demand for safe assets grows again, today 10-year bond yields fell 0.44% to 1.433.
Oil futures prices dropped toward $73 a barrel on Tuesday after the International Energy Agency (IEA) said the Omicron coronavirus variant is set to dent global demand recovery.
Spot Brent crude oil down 1.14% to $72.86 per barrel. US West Texas Intermediate crude lost 1.27% to $69.81 a barrel.
The yellow metal gold is slipped 0.17% to 1769.25 dollars per ounce.
Market Wrap: Forex
The U.S. dollar rose again on Tuesday after rebounding from a dip that nearly wiped out its gains from the day before as markets jostled with the different paths major central banks are choosing between fighting inflation or the economic drag of the pandemic.
Today, the U.S. dollar index measures the greenback against a trade-weighted basket of six major currencies, which slipped 0.10% to 96.445.
The Euro US Dollar (EUR/USD) is a widely traded pair that is rose 0.12% today. This left the pairing trading around $1.12690.
The Japanese yen flat against the U.S. dollar on Wednesday as the stock pushes lower. Today US/JPY is flat to 113.710 level.
Another commodity-related currency mixed against the U.S dollar, AUD/USD gained 0.20% to 0.71130, and NZD/USD declined 0.10% to 0.67360 level.
EUR/USD Intraday: In a consolidation zone
Our pivot point is at 1.12930
Preferable Price Action: Take Short positions Below pivot level with targets at 1.12490 & 1.12260 in extension.
Alternative Price Action: Above pivot looks for a further Upside to 1.13330 & 1.13560.
Comment: Pair below its 55MA and RSI above 50 levels.
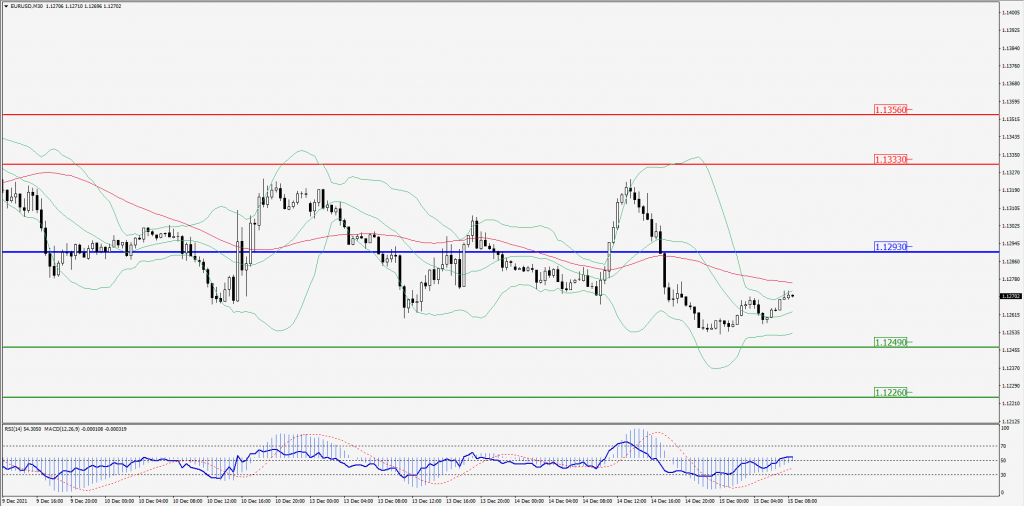
Green Lines Indicate Resistance Levels – Red Lines Indicates Support Levels
Light Blue is a Pivot Point – Black represents the price when the report was produced
GBP/USD Intraday: Support at 1.32200
Our pivot point is at 1.32200
Preferable Price Action: Buy positions above pivot with targets at 1.32660 & 1.32830 in extension.
Alternative Price Action: The price below pivot would call for further downside to 1.31830 & 1.31630.
Comment: Pair above its 55MA & 20MA and RSI above 50 levels.
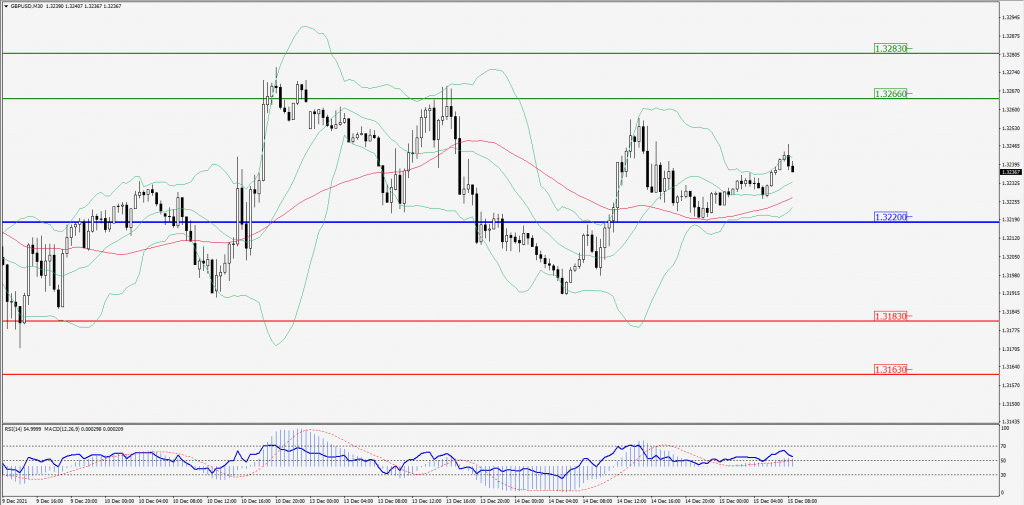
Green Lines Indicate Resistance Levels – Red Lines Indicates Support Levels
Light Blue is a Pivot Point – Black represents the price when the report was produced
USD/JPY Intraday: In a consolidation area
Our pivot point is at 113.590
Preferable Price Action: Buy position Above pivot with the target at 113.860 and 113.990 in extension.
Alternative Price Action: The Downside breakout of the pivot would call for 113.330 and 113.230.
Comment: Price above its 55MA and MACD in positive territory.
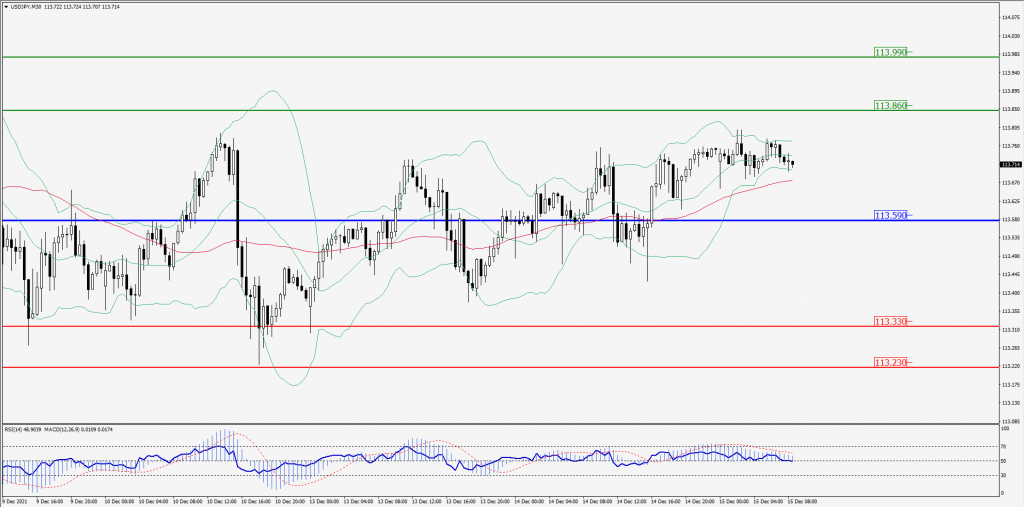
Green Lines Indicate Resistance Levels – Red Lines Indicates Support Levels
Light Blue is a Pivot Point – Black represents the price when the report was produced
AUD/USD Intraday: Support at 0.71030
Our pivot point is at 0.71030
Preferable Price Action: Buy Positions above pivot with targets at 0.71430 & 0.71630 in extension.
Alternative Price Action: Below pivot looks for a further downside with 0.70690 & 0.70490 as targets.
Comment: Pair above its 55MA & 20MA and RSI above 50 levels.
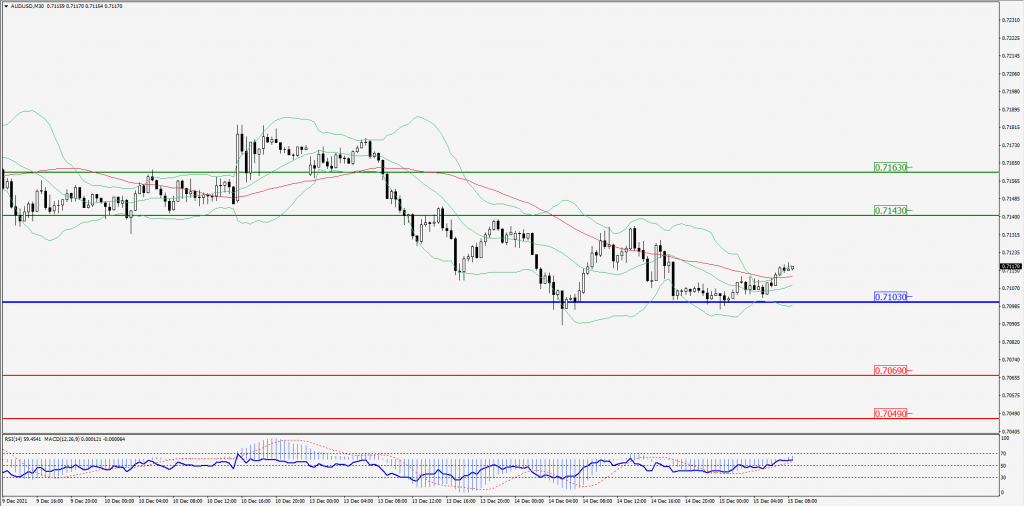
Green Lines Indicate Resistance Levels – Red Lines Indicates Support Levels
Light Blue is a Pivot Point – Black represents the price when the report was produced
CRUDEOIL Intraday: Trend on the downside
Our pivot point is at 70.60
Preferable Price Action: Below pivots Sell Oil with 68.90 & 67.90 as targets.
Alternative Price Action: Buy crude Above pivot with targets at 72.60 and 73.60 in extension.
Comment: Crude is above its 20MA and MACD in the negative territory.
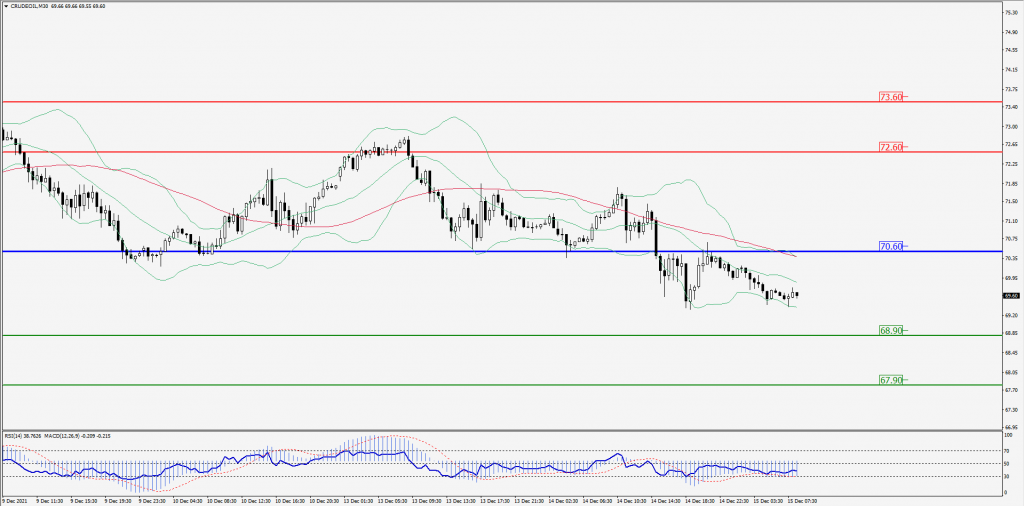
Green Lines Indicate Resistance Levels – Red Lines Indicates Support Levels
Light Blue is a Pivot Point – Black represents the price when the report was produced
XAU/USD Intraday: Resistance at 1776.90
Our pivot point is 1776.90
Preferable Price Action: Further Downside to 1766.00 and 1761.90.
Alternative Price Action: If the price gives an upside breakout of a pivot, then the price extends to 1786.30 and 1791.30.
Comment: MACD in negative territory and price below its 20MA & 55MA.
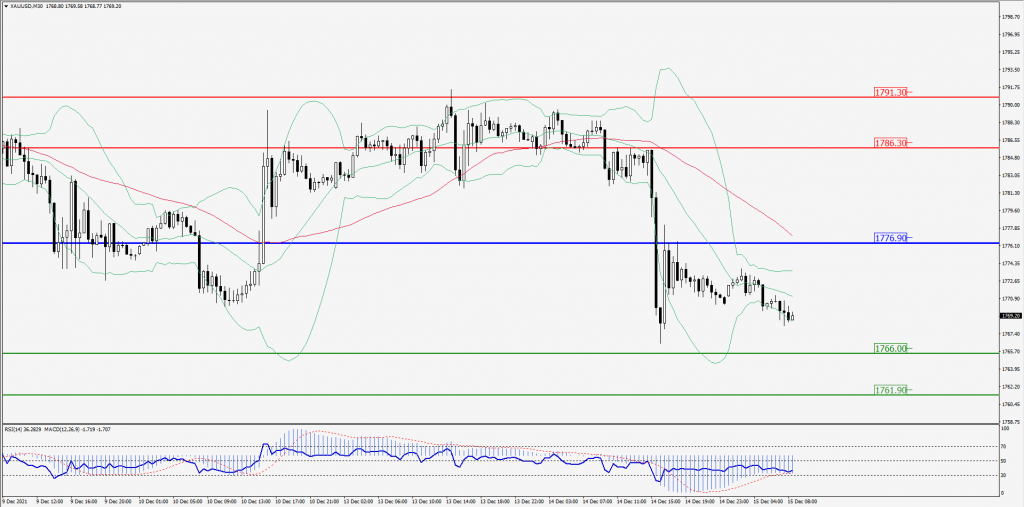
Green Lines Indicate Resistance Levels – Red Lines Indicates Support Levels
Light Blue is a Pivot Point – Black represents the price when the report was produced
Dow Jones Intraday: Resistance 35,790.00
Our pivot point is 35,790.00
Preferable Price Action: Take Short positions below pivot with targets at 35,466.00 & 35,330.00.
Alternative Price Action: Below 35,830.00 looks for further Upside to 36,066.00 & 36,196.00.
Comment: Price below its 55MA & 20MA and RSI below 50 levels.
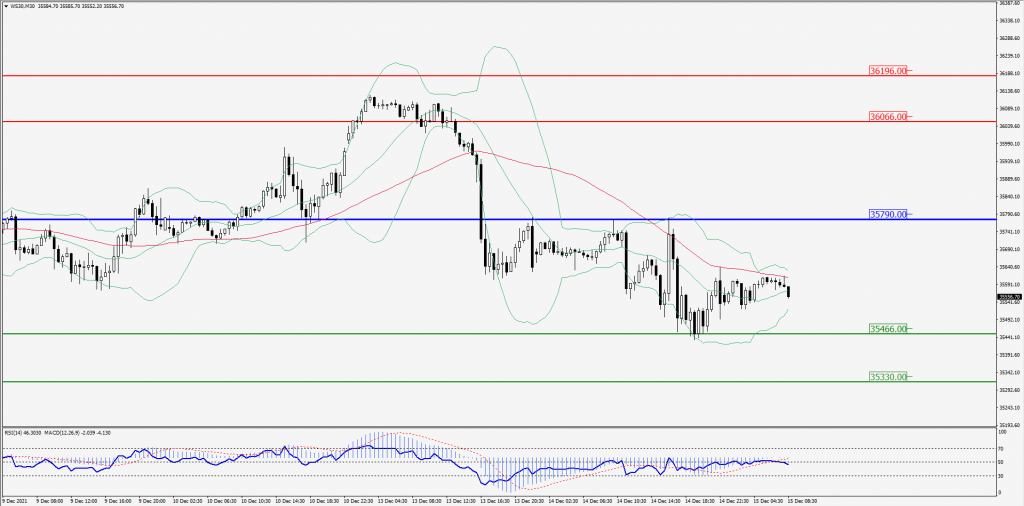
Green Lines Indicate Resistance Levels – Red Lines Indicates Support Levels
Light Blue is a Pivot Point – Black represents the price when the report was produced