Market Wrap: Stocks, Bonds, Commodities
The Dow Industrial and S&P 500 edged up to closing records on Friday and notched a second straight week of gains, buoyed by a climb in Walt Disney shares, but a sharp drop in consumer sentiment kept gains in check.
China’s Ningbo-Zhoushan container port, the world’s third-busiest, remained partially closed for a sixth day Monday, amid ongoing concern over whether the shutdown will disrupt trade from the region longer term.
The Dow Jones Industrial Average rose 15.53 points (0.04%) to 35,515.38, the S&P 500 gained 7.17 points (0.16%) to 4,468.00 and the Nasdaq Composite added 6.64 points (0.04%) to 14,822.90.
Asian share markets made a cautious start to the week on Monday ahead of a raft of Chinese data that could confirm a slowdown in the giant economy, as much of the world races to stem the spread of the Delta variant of COVID-19 with vaccinations.
MSCI’s index of Asia-Pacific stocks outside Japan lost 0.56% to 816.10 levels. Australian index lost 0.61% to 7,582.50. Japanese Nikkei traded 1.62% lower to 27,523.19.
European stocks were lower on Monday, with the Stoxx Europe 50 Index flat to 4,226.15, Germany’s DAX rose 0.08% to 15,950.85, and France’s CAC up 0.16% to 6,893.73, and U.K.’s FTSE 100 up 0.29% to 7,214.15.
Benchmark 10-year U.S. Treasury rose as demand for safe assets grows again, today 10-year bond yields lost 2.85% to 1.260.
Oil prices fell more than 1% on Monday, dropping for a third session, as government-imposed restrictions on mobility to counter the spread of the Delta variant raised worries about a recovery in fuel demand.
Spot Brent crude oil lost 1.27% to $69.69 per barrel. US West Texas Intermediate crude slipped 1.41% to $67.25 a barrel.
The yellow metal traded 0.19% lower to 1774.85 dollars per ounce.
Market Wrap: Forex
The dollar held near a one-week low versus major peers on Monday, after slumping the most in almost seven weeks on Friday as diving U.S. consumer confidence hurt bets for an early tightening of Federal Reserve policy.
Today, the U.S. dollar index measures the greenback against a trade-weighted basket of six major currencies, which rose 0.07% to 92.573.
The Euro US Dollar (EUR/USD) is a widely traded pair that lost 0.05% today. This left the pairing trading around $1.17850
The Japanese yen gained against the U.S. dollar on Monday as the stock pushes higher. Today US/JPY slipped 0.14% to 109.410 level.
Another commodity-related currency lower against the U.S dollar, AUD/USD lost 0.44% to 0.73360, and NZD/USD slipped 0.15% to 0.70270 level.
EUR/USD Intraday: Trend on the upside
Our pivot point is at 1.17780
Preferable Price Action: Take long positions above pivot level with targets at 1.18190 & 1.18430 in extension.
Alternative Price Action: Below pivot looks for a further downside to 1.17390 & 1.17140.
Comment: Pair above its 55MA and RSI below 50 levels.
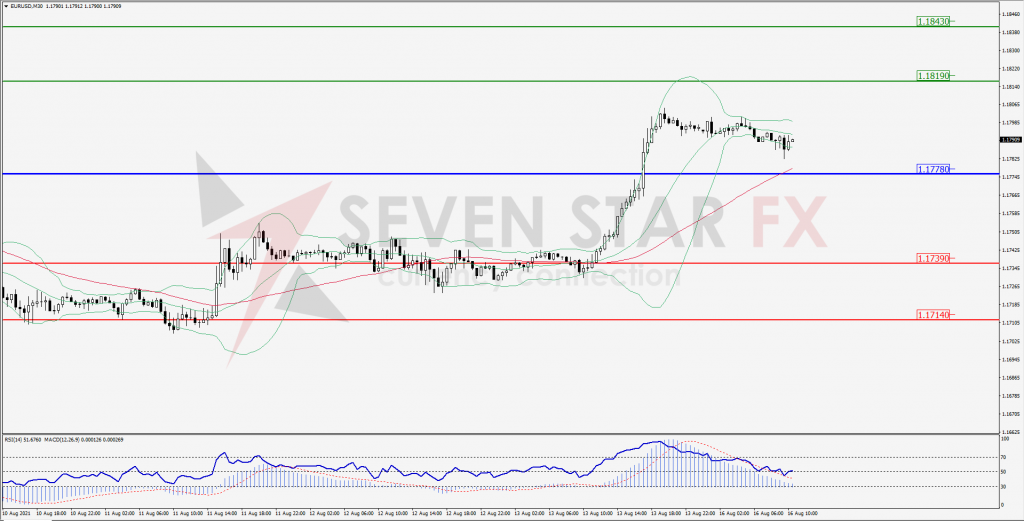
Green Lines Indicate Resistance Levels – Red Lines Indicates Support Levels
Light Blue is a Pivot Point – Black represents the price when the report was produced
GBP/USD Intraday: In a consolidation zone
Our pivot point is at 1.38340
Preferable Price Action: Buy positions above pivot with targets at 1.38770 & 1.38990 in extension.
Alternative Price Action: The price below pivot would call for further downside to 1.37930 & 1.37720.
Comment: Price above its 20MA & 55MA and RSI above 50 levels.
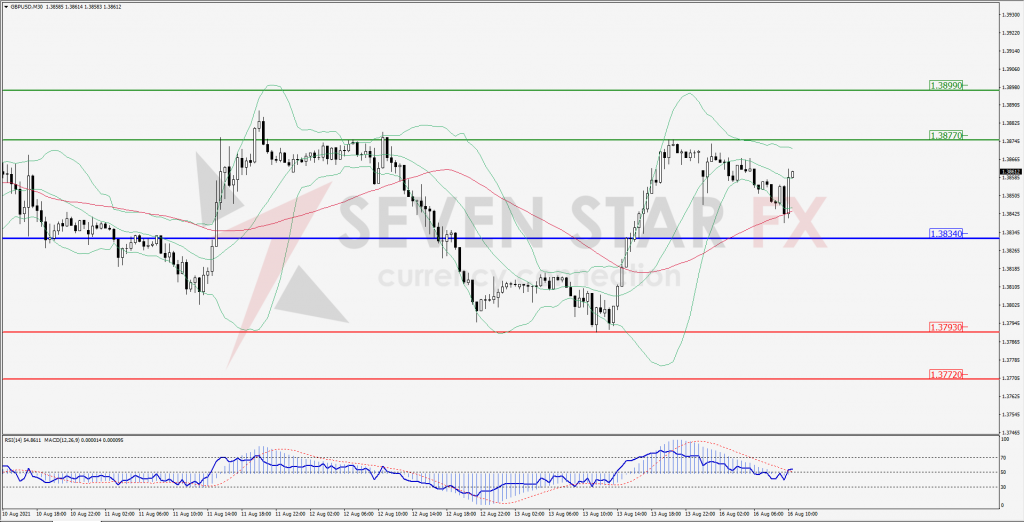
Green Lines Indicate Resistance Levels – Red Lines Indicates Support Levels
Light Blue is a Pivot Point – Black represents the price when the report was produced
USD/JPY Intraday: Trend on the downside
Our pivot point is at 109.580
Preferable Price Action: Sell position below pivot with the target at 109.100 and 108.870 in extension.
Alternative Price Action: The upside breakout of the pivot would call for 110.020 and 110.270.
Comment: price below its 20MA & 55MA and MACD in negative territory.
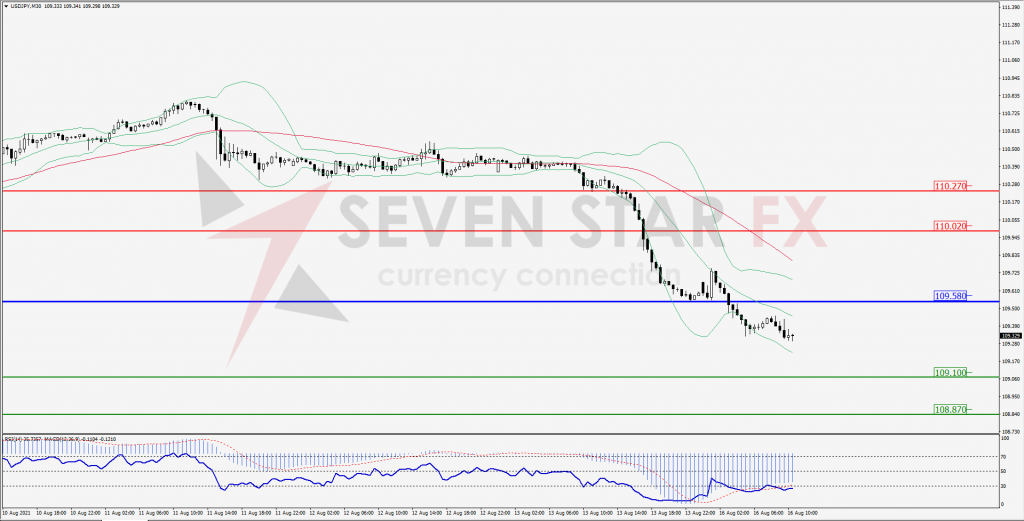
Green Lines Indicate Resistance Levels – Red Lines Indicates Support Levels
Light Blue is a Pivot Point – Black represents the price when the report was produced
AUD/USD Intraday: In a consolidation zone
Our pivot point is at 0.73550
Preferable Price Action: Sell Positions below pivot with targets at 0.73130 & 0.72940 in extension.
Alternative Price Action: Above pivot looks for a further upside with 0.73970 & 0.74160 as targets.
Comment: Pair below its 20MA & 55MA and RSI below 50 levels.
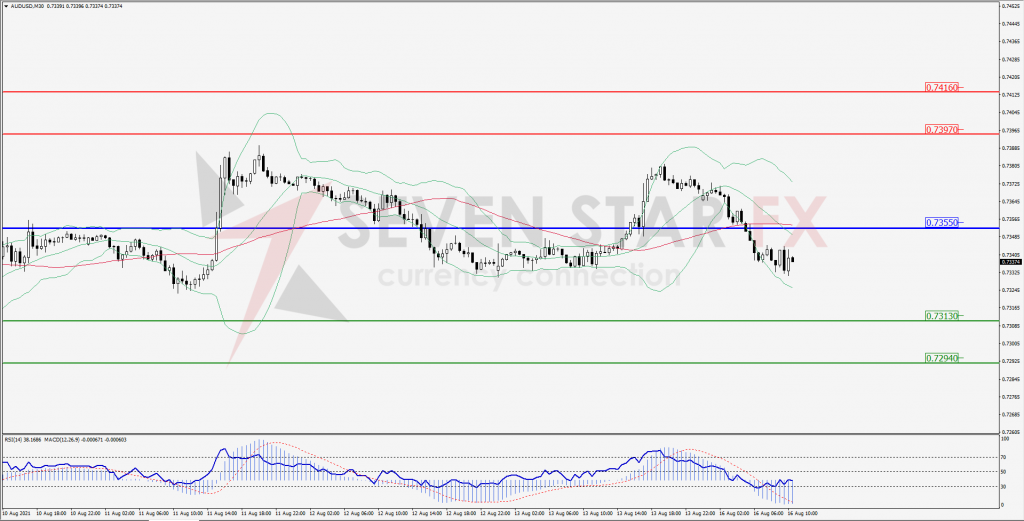
Green Lines Indicate Resistance Levels – Red Lines Indicates Support Levels
Light Blue is a Pivot Point – Black represents the price when the report was produced
CRUDEOIL Intraday: Trend on the downside
Our pivot point is at 67.74
Preferable Price Action: Below pivots sell Oil with 65.80 & 64.67 as targets.
Alternative Price Action: Buy crude above pivot with targets at 69.85 and 70.98 in extension.
Comment: Crude is below its 55MA & 20MA and MACD in the negative territory.
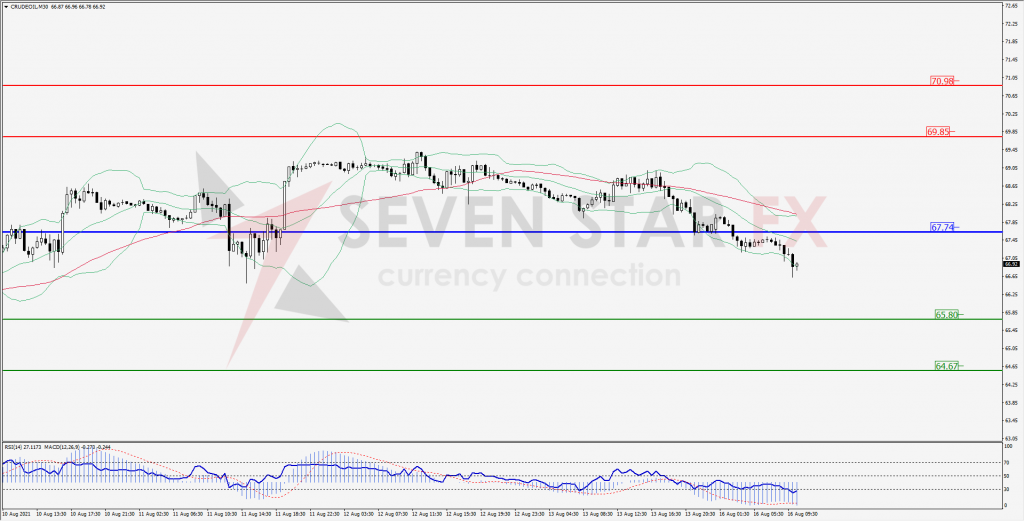
Green Lines Indicate Resistance Levels – Red Lines Indicates Support Levels
Light Blue is a Pivot Point – Black represents the price when the report was produced
XAU/USD Intraday: Strong trend on the upside
Our pivot point is 1768.00
Preferable Price Action: Further upside to 1786.00 & 1797.40.
Alternative Price Action: If the price gives a downside breakout of a pivot, then the price extends to 1749.40 and 1737.40.
Comment: MACD in positive territory and price above its 55MA.
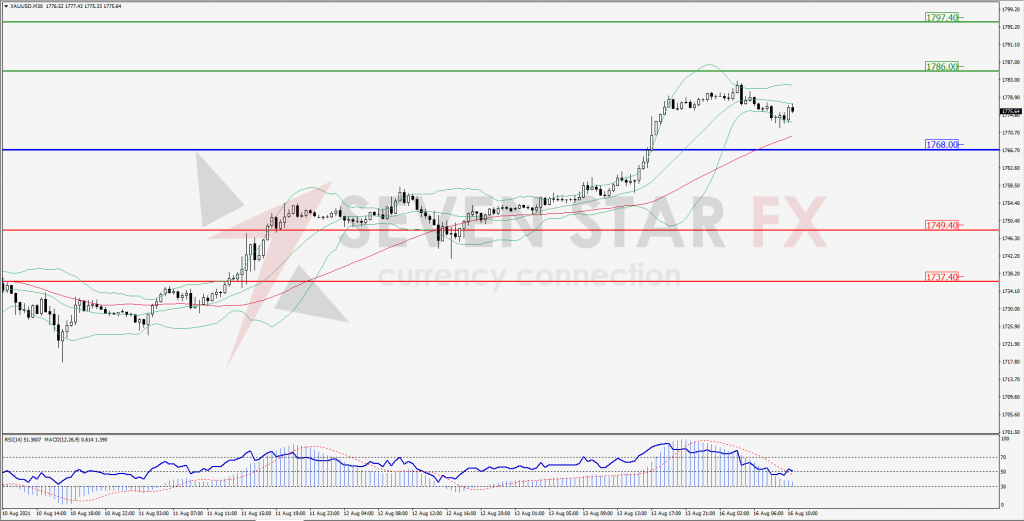
Green Lines Indicate Resistance Levels – Red Lines Indicates Support Levels
Light Blue is a Pivot Point – Black represents the price when the report was produced
Dow Jones Intraday: support at 35,347.00
Our pivot point is 35,347.00
Preferable Price Action: Take long positions above pivot with targets at 35,522.00 & 35,623.00.
Alternative Price Action: below 35,347.00 looks for further downside to 35,187.00 & 35,087.00.
Comment: Price above its 55MA and RSI at 50 levels.
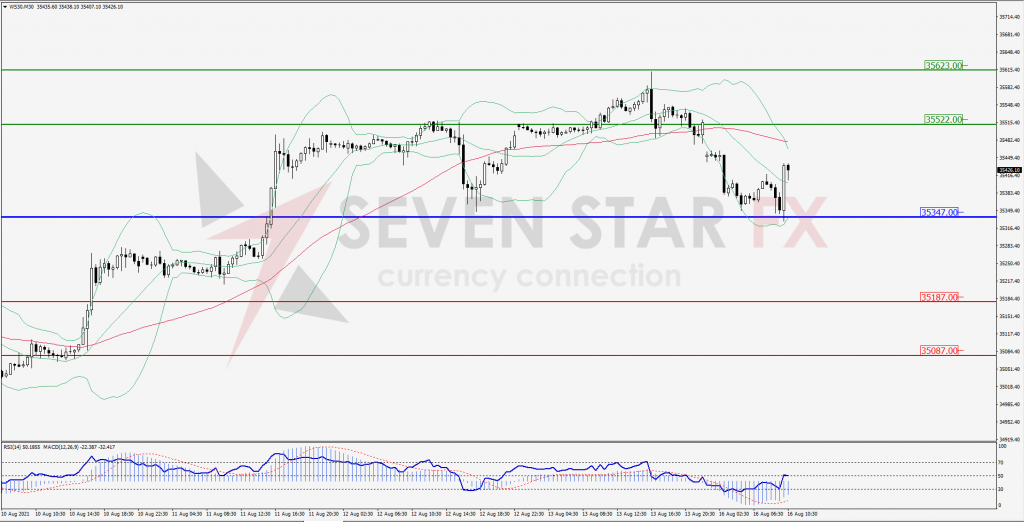
Green Lines Indicate Resistance Levels – Red Lines Indicates Support Levels
Light Blue is a Pivot Point – Black represents the price when the report was produced