Market Wrap: Stocks, Bonds, Commodities
The S&P 500 ended higher on Wednesday after stronger-than-expected retail sales data offered evidence of resilience in the U.S. economy, but gains were capped as investors worried about more interest rate hikes by Federal Reserve in the months ahead.
The Dow Jones Industrial Average rose 38.78 points to 34,128.05, the S&P 500 gain 0.28% to 4,147.60 and the Nasdaq Composite add 110.45 points to 12,070.59
MSCI’s index of Asia-Pacific stocks outside Japan is ascend 0.66% to 655.88 levels. The Australian index was higher by 0.79% to 7,410.30. Japanese Nikkei Index rose 0.71% today.
European stocks were positive on Thursday, with the Stoxx Europe 50 Index gain 0.97% to 4,280.04, Germany’s DAX rose 0.82% to 15,506.34, and France’s CAC ascend 1.21% to 7,300.86, and U.K.’s FTSE 100 add 0.55% to 7,997.83.
Benchmark 10-year U.S. Treasury fell as demand for safe assets ascend again, today 10-year bond yields are negative 0.71% to 3.7800.
Oil futures were flat to lower on Wednesday as the US dollar strengthened and investors worried that rising interest rates would slow the economy and cut fuel demand. Oil’s losses were limited as the market discounted a big build in US crude stocks due to a data adjustment and as the International Energy Agency (IEA) forecast higher global oil demand growth.
Spot Brent crude oil rose 0.71% to $85.99 per barrel. US West Texas Intermediate crude is up 0.95% to $79.34 a barrel.
The yellow metal gold is advance 0.26% to 1,850.10 dollars per ounce.
Market Wrap: Forex
The U.S. dollar edged lower in early European trade Thursday, handing back some of the previous session’s gains after better-than-expected U.S. retail sales pointed to more interest rate hikes by the Federal Reserve.
Today, the U.S. dollar index measures the Greenback against a trade-weighted basket of six major currencies, which slipped 0.24% to 103.590.
The Euro US Dollar (EUR/USD) is a widely traded pair that is up 0.18% today. This left the pair trading around $1.07080.
The Japanese yen was negative against the U.S. dollar on Thursday. Today USD/JPY is decline 0.26% to the 133.750 level.
Another commodity-related currency positive against the U.S dollar, AUD/USD gain 0.29% to 0.69230, and NZD/USD rose 0.33% to 0.63010 level.
EUR/USD Intraday: In a consolidation zone
Our pivot point is at 1.06980
Preferable Price Action: Take long positions above pivot level with targets at 1.07380 & 1.07610 in extension.
Alternative Price Action: Below pivot looks for a further downside to 1.06590 & 1.06360.
Comment: RSI is at 50 levels.
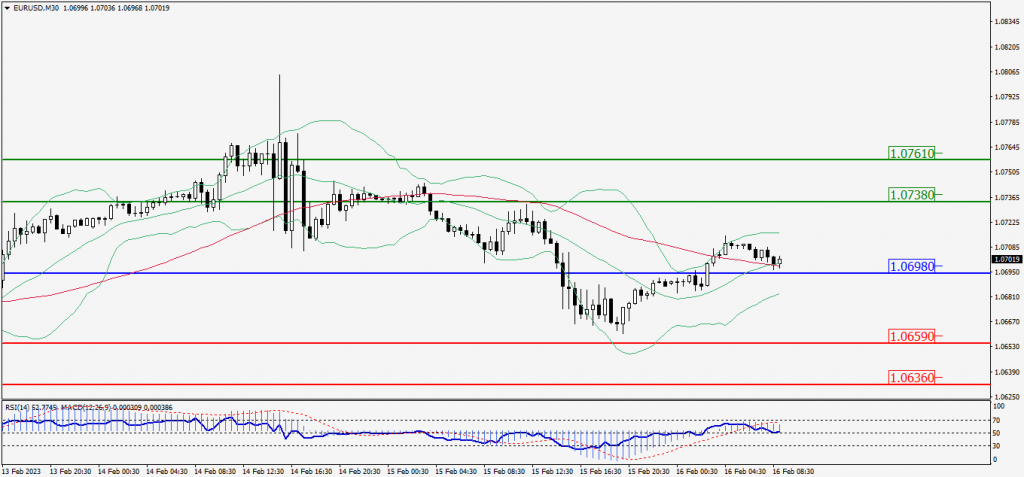
Green Lines Indicate Resistance Levels – Red Lines Indicate Support Levels
Light Blue is a Pivot Point – Black represents the price when the report was produced
GBP/USD Intraday: Resistance level at 1.20650
Our pivot point is at 1.20650
Preferable Price Action: Sell positions below pivot with targets at 1.19880 & 1.19450 in extension.
Alternative Price Action: The price above pivot would call for further upside to 1.21360 & 1.21820.
Comment: RSI is below 50 levels and Pairs below 55MA.
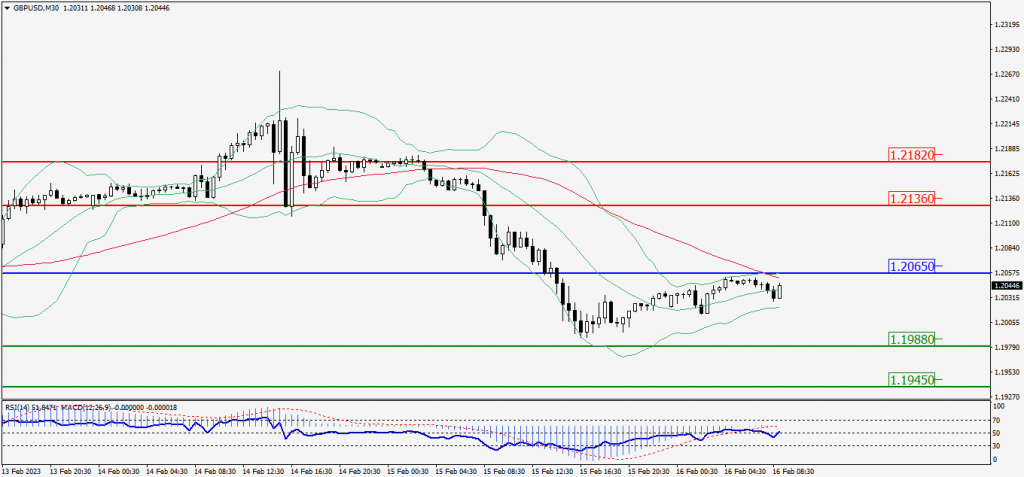
Green Lines Indicate Resistance Levels – Red Lines Indicate Support Levels
Light Blue is a Pivot Point – Black represents the price when the report was produced
USD/JPY Intraday: Support level at 133.830
Our pivot point is at 133.830
Preferable Price Action: Buy position above pivot with the target at 134.540 and 134.990 in extension.
Alternative Price Action: The downside breakout of the pivot would call for 133.100 and 132.640.
Comment: MACD is above 50 level and Pairs above 55MA.
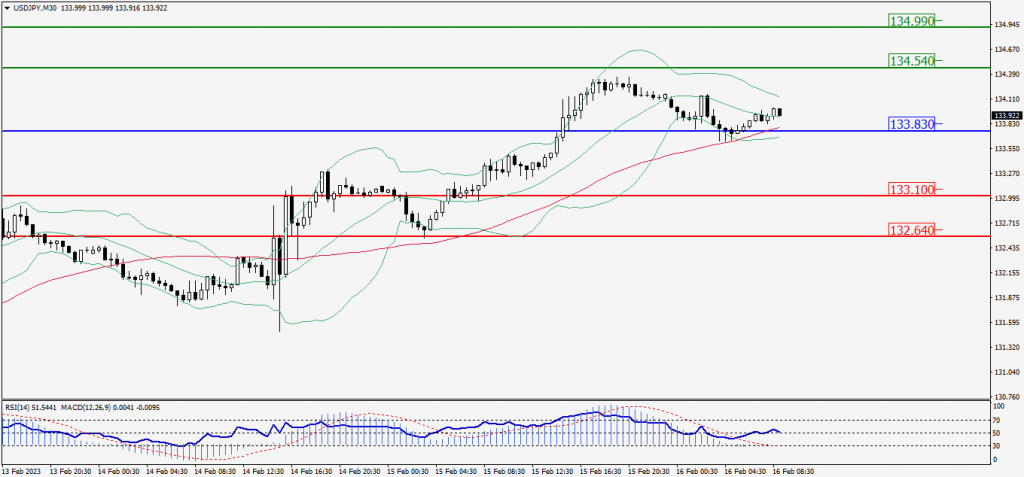
Green Lines Indicate Resistance Levels – Red Lines Indicate Support Levels
Light Blue is a Pivot Point – Black represents the price when the report was produced
AUD/USD Intraday: Trend on the upside
Our pivot point is at 0.69120
Preferable Price Action: Buy positions above pivot with targets at 0.69460 & 0.69670 in extension.
Alternative Price Action: Below pivot looks for a further downside with 0.68770 & 0.68570 as targets.
Comment: RSI is above 50 levels and pairs above its 20MA & 55MA.
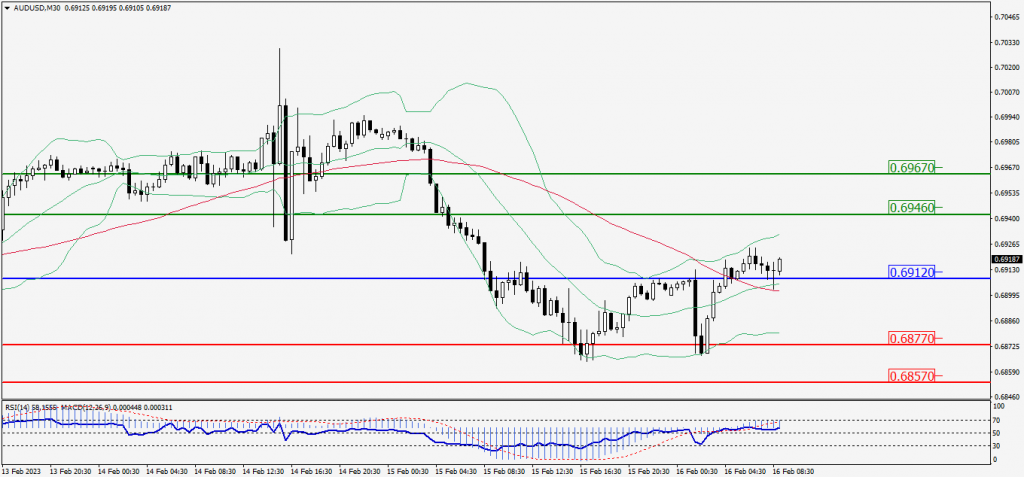
Green Lines Indicate Resistance Levels – Red Lines Indicate Support Levels
Light Blue is a Pivot Point – Black represents the price when the report was produced
CRUDEOIL Intraday: Trend on the upside
Our pivot point is at 79.43
Preferable Price Action: Above pivot buy oil with 80.03 & 80.42 as targets.
Alternative Price Action: Sell crude below pivot with targets at 78.83 and 78.45 in extension.
Comment: MACD is positive territory and Pairs above its 20MA & 55MA.
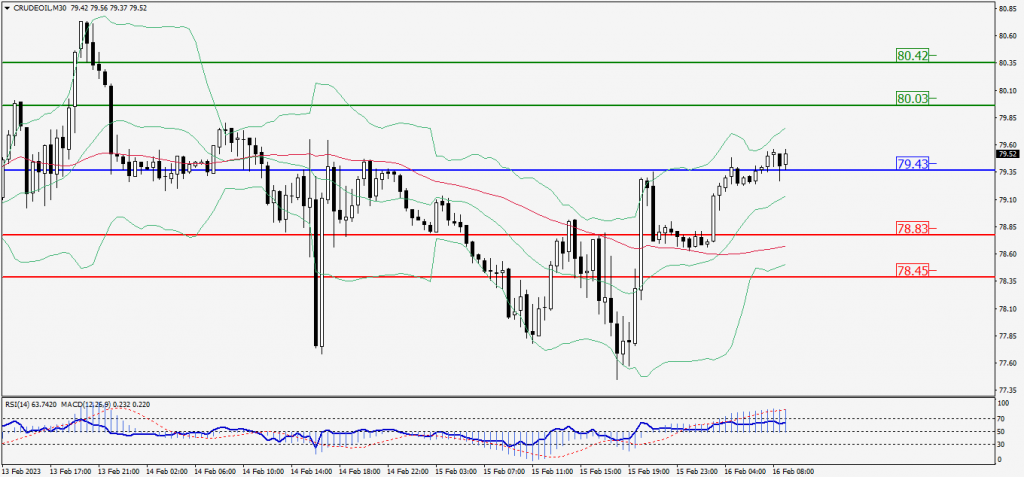
Green Lines Indicate Resistance Levels – Red Lines Indicate Support Levels
Light Blue is a Pivot Point – Black represents the price when the report was produced
XAU/USD Intraday: In a consolidation zone
Our pivot point is 1837.80
Preferable Price Action: Further upside to 1849.40 and 1856.80
Alternative Price Action: If the price gives a downside breakout of a pivot, then the price extends to 1826.10 and 1818.80.
Comment: MACD is at 50 level.
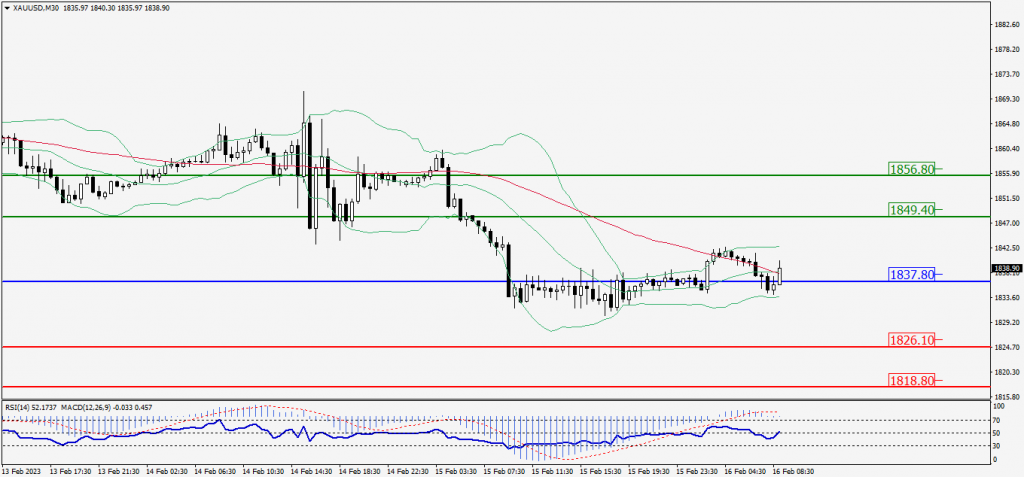
Green Lines Indicate Resistance Levels – Red Lines Indicate Support Levels
Light Blue is a Pivot Point – Black represents the price when the report was produced
Dow Jones Intraday: Trend on the upside
Our pivot point is 34,125.00
Preferable Price Action: Take buy positions above the pivot with targets at 34,131.00 & 34,135.00.
Alternative Price Action: Below 34,125.00 looks for further downside to 34,119.00 & 34,115.00.
Comment: RSI is above 50 levels and Pairs above its 20MA & 55MA.
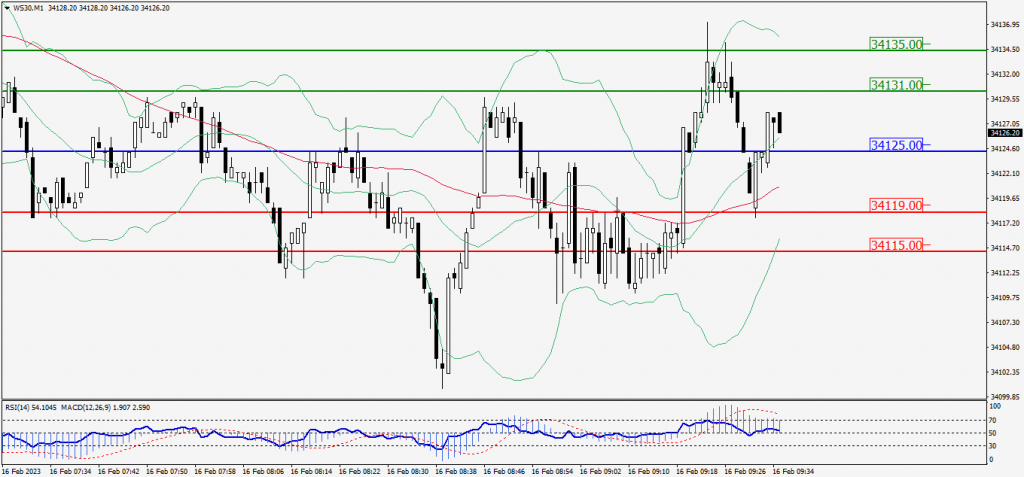
Green Lines Indicate Resistance Levels – Red Lines Indicate Support Levels
Light Blue is a Pivot Point – Black represents the price when the report was produced