Market Wrap: Stocks, Bonds, Commodities
Wall Street ended sharply lower on Thursday after unexpectedly strong inflation data and a drop in weekly jobless claims added to fears that the US Federal Reserve will keep raising interest rates to tame high prices.
The Dow Jones Industrial Average fell 431.20 points to 33,696.85, the S&P 500 lose 1.38% to 4,090.41 and the Nasdaq Composite subtract 214.76 points to 11,855.83
MSCI’s index of Asia-Pacific stocks outside Japan is decline 1.24% to 648.06 levels. The Australian index was lower by 0.86% to 7,346.80. Japanese Nikkei Index fell 0.66% today.
European stocks were positive on Friday, with the Stoxx Europe 50 Index gain 0.40% to 4,297.24, Germany’s DAX rose 0.18% to 15,533.64, and France’s CAC ascend 0.89% to 7,366.16, and U.K.’s FTSE 100 add 0.18% to 8,012.53.
Benchmark 10-year U.S. Treasury fell as demand for safe assets ascend again, today 10-year bond yields are positive 1.13% to 3.8860.
Oil prices settled slightly lower on Thursday after trading in a narrow range as the market weighed mixed US economic signals and prospects for a Chinese demand recovery with a build in U.S. crude stockpiles.
Spot Brent crude oil fell 1.15% to $84.16 per barrel. US West Texas Intermediate crude is down 1.26% to $77.50 a barrel.
The yellow metal gold is decline 0.94% to 1,834.40 dollars per ounce.
Market Wrap: Forex
The U.S. dollar surged to a six-week high in early European trade Friday, after strong U.S. economic data and hawkish comments from Federal Reserve policymakers pointed to more interest rate hikes.
Today, the U.S. dollar index measures the Greenback against a trade-weighted basket of six major currencies, which surge 0.50% to 104.312.
The Euro US Dollar (EUR/USD) is a widely traded pair that is down 0.25% today. This left the pair trading around $1.06410.
The Japanese yen was positive against the U.S. dollar on Friday. Today USD/JPY is advance 0.55% to the 134.680 level.
Another commodity-related currency negative against the U.S dollar, AUD/USD lose 0.44% to 0.68460, and NZD/USD fell 0.53% to 0.62210 level.
EUR/USD Intraday: Major trend on the downside
Our pivot point is at 1.06500
Preferable Price Action: Take short positions below pivot level with targets at 1.05990 & 1.05680 in extension.
Alternative Price Action: Above pivot looks for a further upside to 1.07010 & 1.07330.
Comment: RSI is below 50 levels and Pairs below its 20MA & 55MA.
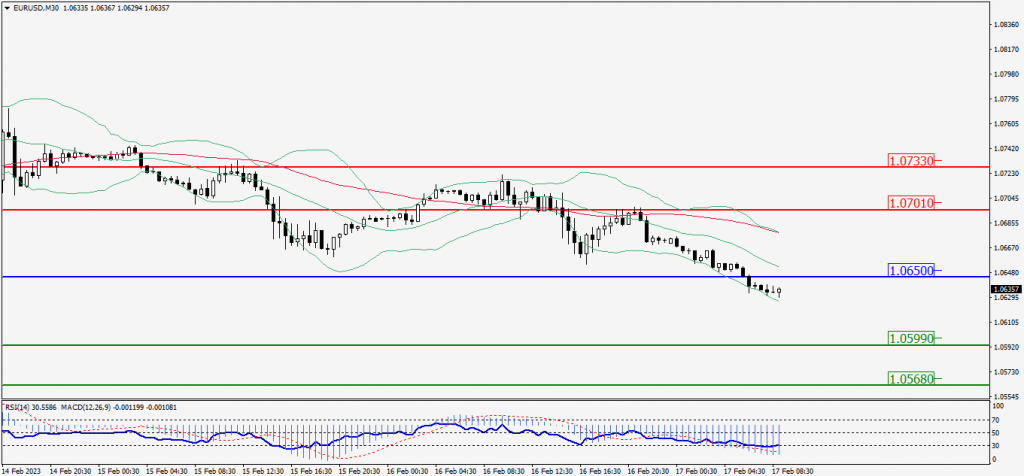
Green Lines Indicate Resistance Levels – Red Lines Indicate Support Levels
Light Blue is a Pivot Point – Black represents the price when the report was produced
GBP/USD Intraday: Trend on the downside
Our pivot point is at 1.19690
Preferable Price Action: Sell positions below pivot with targets at 1.18630 & 1.18030 in extension.
Alternative Price Action: The price above pivot would call for further upside to 1.20650 & 1.21300.
Comment: RSI is below 50 levels and Pairs below its 20MA & 55MA.
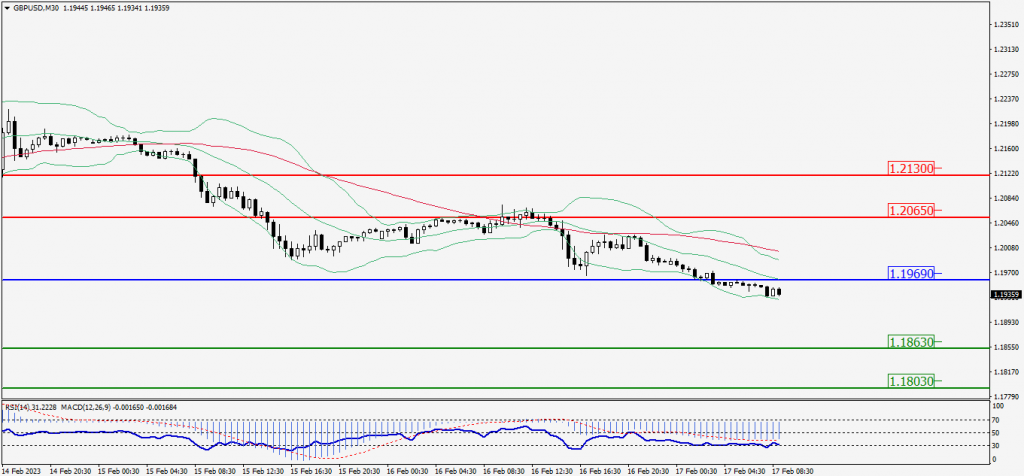
Green Lines Indicate Resistance Levels – Red Lines Indicate Support Levels
Light Blue is a Pivot Point – Black represents the price when the report was produced
USD/JPY Intraday: Major trend on the upside
Our pivot point is at 134.660
Preferable Price Action: Buy position above pivot with the target at 135.510 and 136.020 in extension.
Alternative Price Action: The downside breakout of the pivot would call for 133.850 and 133.310.
Comment: MACD is above 50 level and Pairs above its 20MA & 55MA.
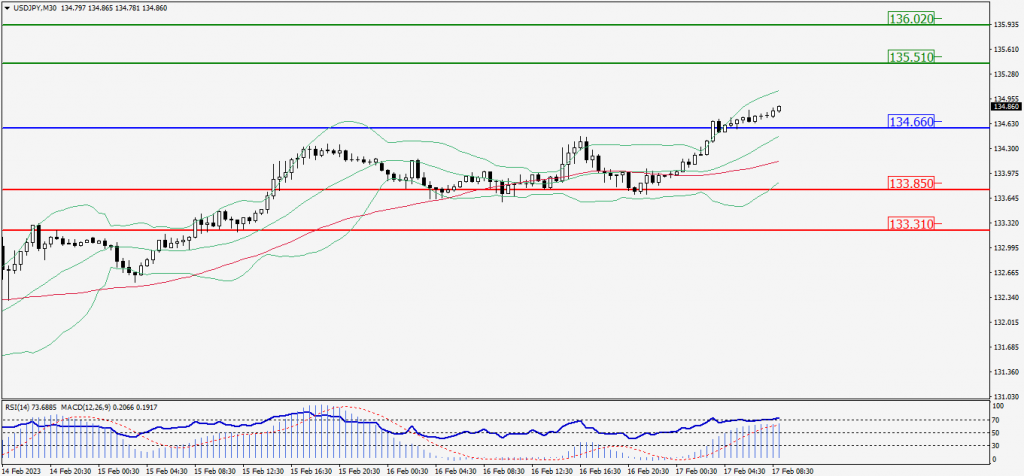
Green Lines Indicate Resistance Levels – Red Lines Indicate Support Levels
Light Blue is a Pivot Point – Black represents the price when the report was produced
AUD/USD Intraday: Trend on the downside
Our pivot point is at 0.68510
Preferable Price Action: Sell positions below pivot with targets at 0.68070 & 0.67800 in extension.
Alternative Price Action: Above pivot looks for a further upside with 0.68070 & 0.67800 as targets.
Comment: RSI is below 50 levels and pairs below its 20MA & 55MA.
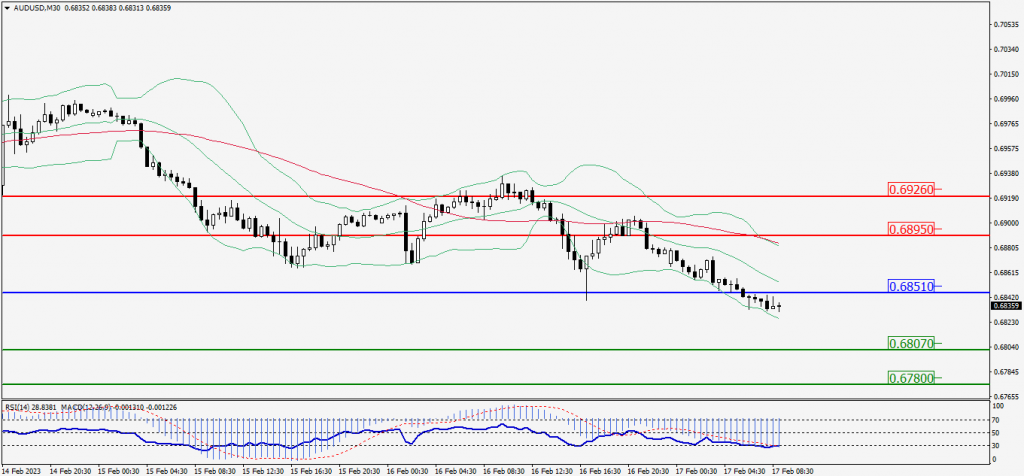
Green Lines Indicate Resistance Levels – Red Lines Indicate Support Levels
Light Blue is a Pivot Point – Black represents the price when the report was produced
CRUDEOIL Intraday: Trend on the downside
Our pivot point is at 77.70
Preferable Price Action: Below pivot sell oil with 76.80 & 76.18 as targets.
Alternative Price Action: Buy crude above pivot with targets at 78.63 and 79.28 in extension.
Comment: MACD is negative territory and Pairs below its 20MA & 55MA.
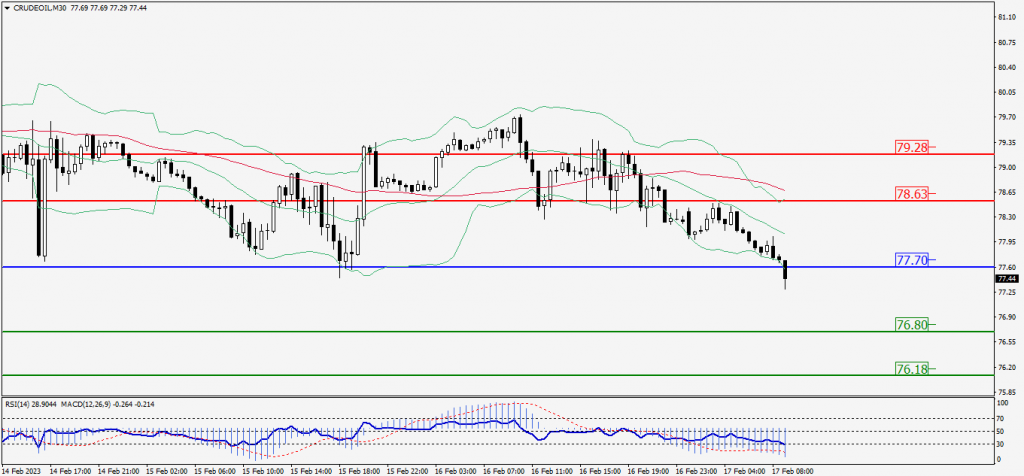
Green Lines Indicate Resistance Levels – Red Lines Indicate Support Levels
Light Blue is a Pivot Point – Black represents the price when the report was produced
XAU/USD Intraday: Trend on the downside
Our pivot point is 1828.90
Preferable Price Action: Further downside to 1845.10 and 1855.50
Alternative Price Action: If the price gives an upside breakout of a pivot, then the price extends to 1845.10 and 1855.50.
Comment: MACD is below 50 level and Pairs below its 20MA & 55MA..
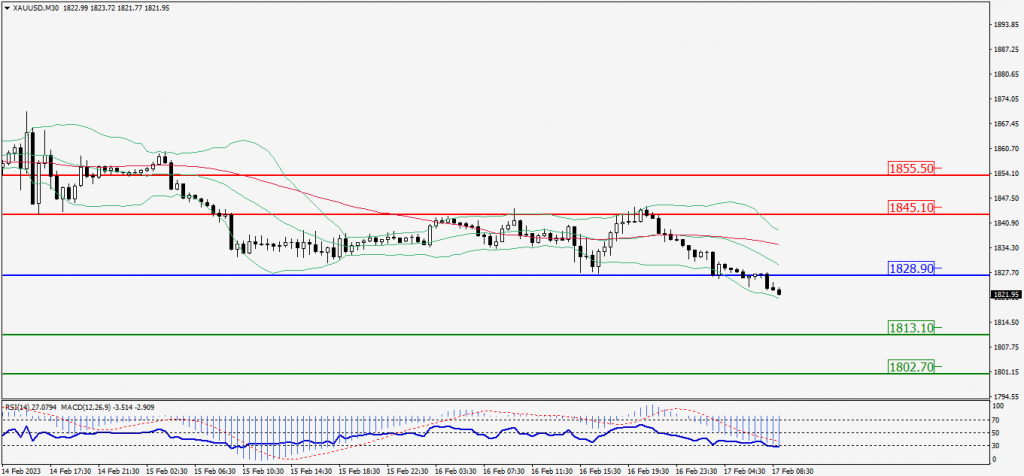
Green Lines Indicate Resistance Levels – Red Lines Indicate Support Levels
Light Blue is a Pivot Point – Black represents the price when the report was produced
Dow Jones Intraday: Support level at 33,600.00
Our pivot point is 33,600.00
Preferable Price Action: Take buy positions above the pivot with targets at 33,615.00 & 33,625.00.
Alternative Price Action: Below 33,600.00 looks for further downside to 33,586.00 & 33,576.00.
Comment: RSI is above 50 levels and Pairs above its 20MA & 55MA.
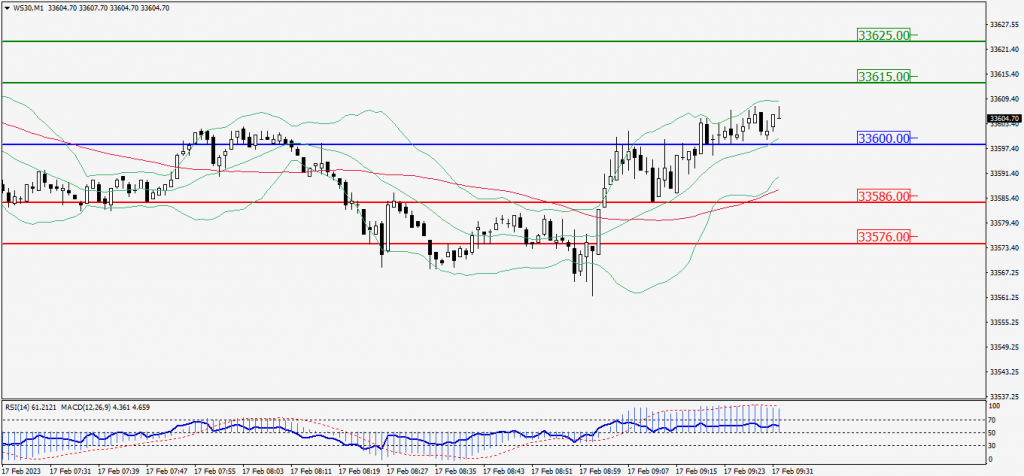
Green Lines Indicate Resistance Levels – Red Lines Indicate Support Levels
Light Blue is a Pivot Point – Black represents the price when the report was produced