Market Wrap: Stocks, Bonds, Commodities
Wall Street stocks ended mixed on Tuesday after US consumer price data for January offered little to change expectations about the Federal Reserve’s path forward on interest rate hikes.
The Dow Jones Industrial Average fell 156.66 points to 34,089.27, the S&P 500 lose 0.03% to 4,136.13 and the Nasdaq Composite add 68.36 points to 11,960.14
MSCI’s index of Asia-Pacific stocks outside Japan is drop 1.48% to 650.51 levels. The Australian index was lower by 1.06% to 7,352.20. Japanese Nikkei Index fell 0.37% today.
European stocks were mix on Wednesday, with the Stoxx Europe 50 Index lose 0.06% to 4,238.76, Germany’s DAX fell 0.11% to 15,380.56, and France’s CAC ascend 0.07% to 7,213.81, and U.K.’s FTSE 100 add 0.08% to 7,953.85.
Benchmark 10-year U.S. Treasury fell as demand for safe assets ascend again, today 10-year bond yields are negative 0.47% to 3.7430.
Oil prices settled 1 percent lower on Tuesday as traders worried about mounting supplies, and prices extended losses in post-settlement trading after sources said data from the American Petroleum Institute showed a large build in US crude oil and distillate inventories.
Spot Brent crude oil fell 1.26% to $84.50 per barrel. US West Texas Intermediate crude is down 1.45% to $77.91 a barrel.
The yellow metal gold is advance 0.99% to 1,846.85 dollars per ounce.
Market Wrap: Forex
The U.S. dollar climbed higher in early European trade Wednesday after U.S. consumer inflation remained elevated in January, while sterling fell after a drop in the U.K. CPI rate.
Today, the U.S. dollar index measures the Greenback against a trade-weighted basket of six major currencies, which surge 031% to 103.440.
The Euro US Dollar (EUR/USD) is a widely traded pair that is down 0.19% today. This left the pair trading around $1.07150.
The Japanese yen was positive against the U.S. dollar on Wednesday. Today USD/JPY is advance 0.14% to the 133.300 level.
Another commodity-related currency negative against the U.S dollar, AUD/USD lose 1.07% to 0.69100, and NZD/USD fell 0.72% to 0.62900 level.
EUR/USD Intraday: Trend on the downside
Our pivot point is at 1.07170
Preferable Price Action: Take short positions below pivot level with targets at 1.06870 & 1.06710 in extension.
Alternative Price Action: Above pivot looks for a further upside to 1.07460 & 1.07620.
Comment: RSI is below 50 levels and Pairs below its 20MA & 55MA.
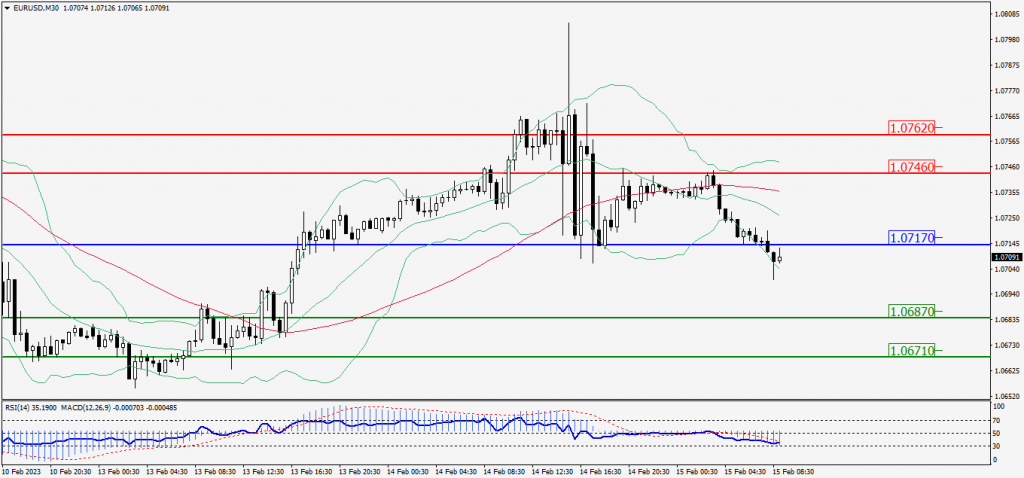
Green Lines Indicate Resistance Levels – Red Lines Indicate Support Levels
Light Blue is a Pivot Point – Black represents the price when the report was produced
GBP/USD Intraday: Major trend on the downside
Our pivot point is at 1.21110
Preferable Price Action: Sell positions below pivot with targets at 1.20660 & 1.20390 in extension.
Alternative Price Action: The price above pivot would call for further upside to 1.21560 & 1.21850.
Comment: RSI is below 50 levels and Pairs below its 20MA & 55MA.
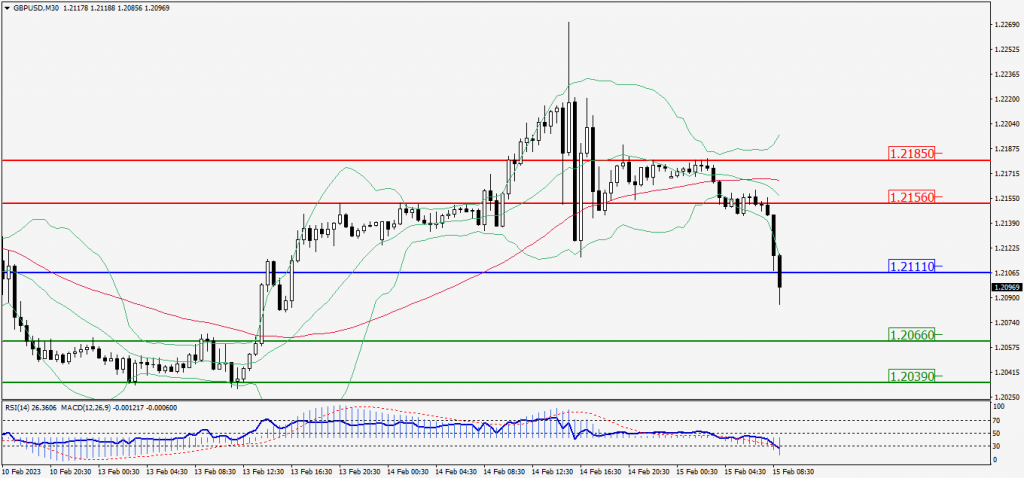
Green Lines Indicate Resistance Levels – Red Lines Indicate Support Levels
Light Blue is a Pivot Point – Black represents the price when the report was produced
USD/JPY Intraday: Trend on the upside
Our pivot point is at 133.290
Preferable Price Action: Buy position above pivot with the target at 134.250 and 134.860 in extension.
Alternative Price Action: The downside breakout of the pivot would call for 132.360 and 131.760.
Comment: MACD is above 50 level and Pairs above its 20MA & 55MA.
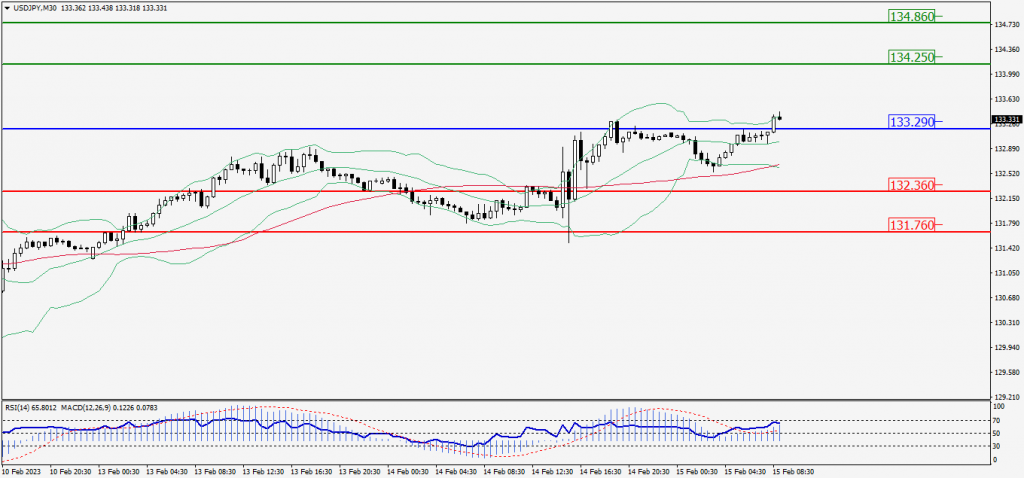
Green Lines Indicate Resistance Levels – Red Lines Indicate Support Levels
Light Blue is a Pivot Point – Black represents the price when the report was produced
AUD/USD Intraday: Trend on the downside
Our pivot point is at 0.69290
Preferable Price Action: Sell positions below pivot with targets at 0.68940 & 0.68710 in extension.
Alternative Price Action: Above pivot looks for a further upside with 0.69650 & 0.69860 as targets.
Comment: RSI is below 50 levels and pairs below its 20MA & 55MA.
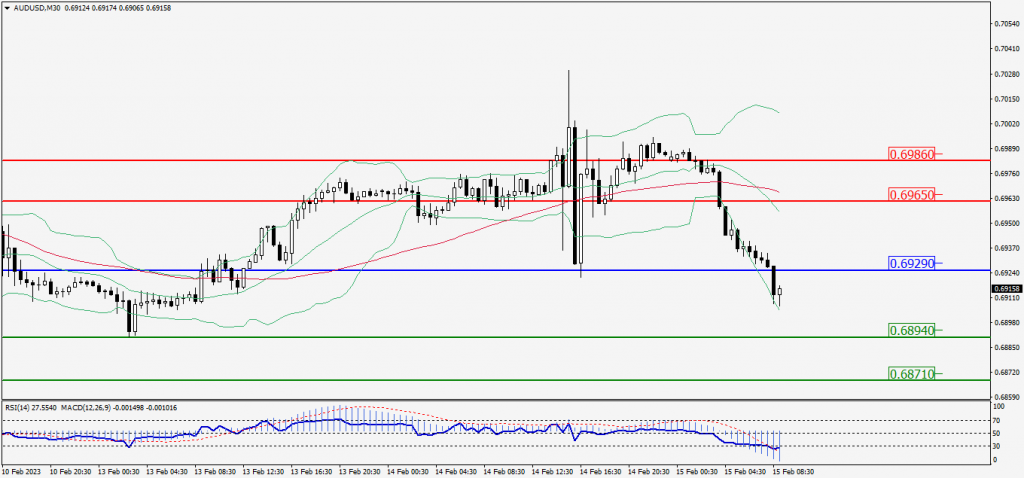
Green Lines Indicate Resistance Levels – Red Lines Indicate Support Levels
Light Blue is a Pivot Point – Black represents the price when the report was produced
CRUDEOIL Intraday: Trend on the downside
Our pivot point is at 78.60
Preferable Price Action: Below pivot sell oil with 78.10 & 77.78 as targets.
Alternative Price Action: Buy crude above pivot with targets at 79.16 and 79.49 in extension.
Comment: MACD is negative territory and Pairs below its 20MA & 55MA.
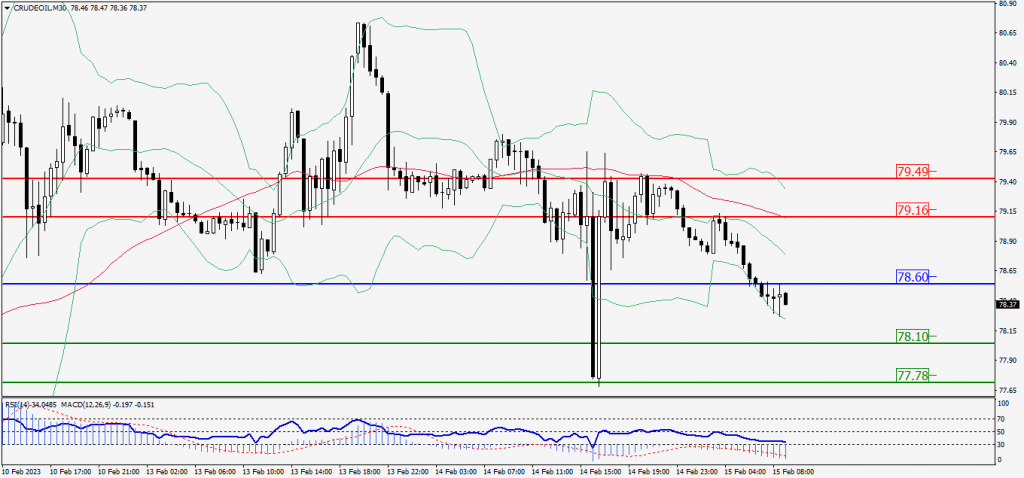
Green Lines Indicate Resistance Levels – Red Lines Indicate Support Levels
Light Blue is a Pivot Point – Black represents the price when the report was produced
XAU/USD Intraday: Major trend on the downside
Our pivot point is 1846.60
Preferable Price Action: Further downside to 1837.20 and 1831.20
Alternative Price Action: If the price gives an upside breakout of a pivot, then the price extends to 1856.40 and 1862.60.
Comment: MACD is below 50 level and Pairs below its 20MA & 55MA.
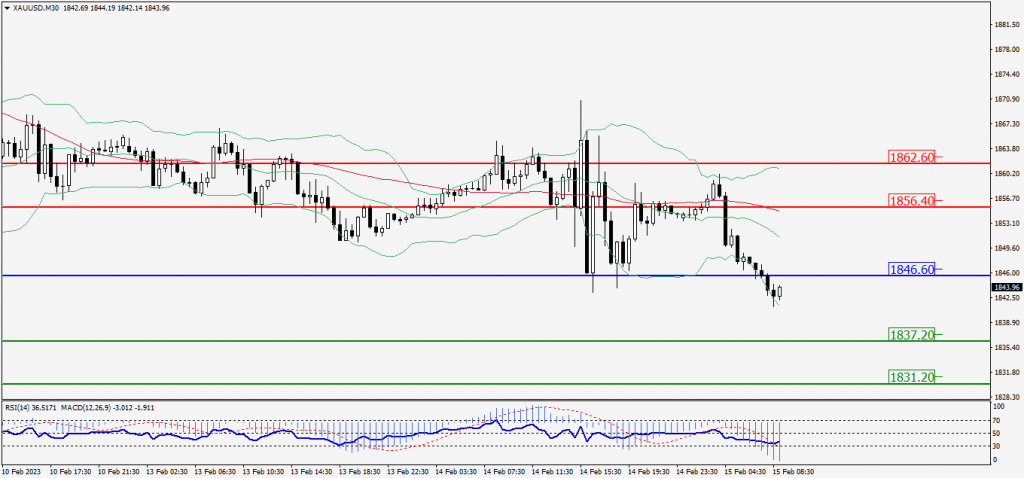
Green Lines Indicate Resistance Levels – Red Lines Indicate Support Levels
Light Blue is a Pivot Point – Black represents the price when the report was produced
Dow Jones Intraday: Resistance level at 34,031.00
Our pivot point is 34,031.00
Preferable Price Action: Take sell positions below the pivot with targets at 33,854.00 & 33,732.00.
Alternative Price Action: Above 34,031.00 looks for further upside to 34,211.00 & 34,327.00.
Comment: RSI is below 50 levels and Pairs below its 20MA & 55MA.
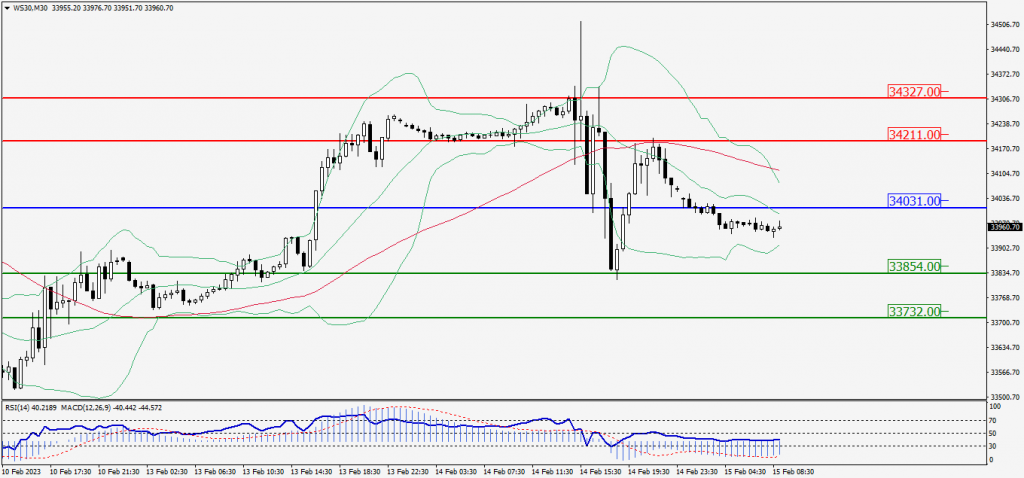
Green Lines Indicate Resistance Levels – Red Lines Indicate Support Levels
Light Blue is a Pivot Point – Black represents the price when the report was produced