Market Wrap: Stocks, Bonds, Commodities
Most Asian currencies were subdued on Friday as the dollar strengthened ahead of a Federal Reserve rate decision next week, while disappointing cues on stimulus from a top-level meeting in China weighed on the yuan.
The Dow Jones Industrial Average fail 234.44 points to 44,914.12, the S&P 500 loss 0.54% to 6,051.25 and the Nasdaq Composite up 132.05 points to 19,902.84.
MSCI’s index of Asia-Pacific stocks outside Japan is down 0.01% to 721.75 levels. The Australian index was lower by 0.41% to 8,296.00. Japanese Nikkei Index decrease 1.02% today.
European stocks were mixed on Friday, with the Stoxx Europe 50 Index increase 0.10% to 4,964.55 Germany’s DAX ascend 0.13% to 20,426.27, and France’s CAC lower 0.03% to 7,420.940 and U.K.’s FTSE 100 gain 0.12% to 8,311.76.
Benchmark 10-year U.S. Treasury Either up or down as demand for safe assets slipped again, today 10-year bond yields 0.01% to 4.3260.
Oil prices stabilised on Friday, heading for their first weekly rise since the end of November, as additional sanctions on Iran and Russia ratcheted up supply worries, while a surplus outlook weighed on markets.
Spot Brent crude oil decrease 0.01% to $73.40 per barrel. US West Texas Intermediate crude is increase 0.06% to $70.06 a barrel.
The yellow metal gold is down 0.03% to 2,708.46 dollars per ounce.
Market Wrap: Forex
Japan stocks were lower after the close on Friday, as losses in the Shipbuilding, Paper & Pulp and Finance & Investment sectors led shares lower.
Today, the U.S. dollar index measures the Greenback against a trade-weighted basket of six major currencies, which either ascend 0.19% to 106.850.
The Euro US Dollar (EUR/USD) is a widely traded is down 0.11% today. This left the pair trading around $1.04550.
The Japanese yen was will move positive against the U.S. dollar on Friday. Today USD/JPY is trades pair that increase 0.15% to the 152.84 level.
Another commodity-related currency negative against the U.S dollar, AUD/USD loss 0.09% to 0.63610, and NZD/USD decrease 0.16% to 0.57600 level.
EUR/USD Intraday: Trend on the downside
Our pivot point is at 1.04710
Preferable Price Action: Take sell positions below pivot level with targets at 1.04460 & 1.04230 in extension.
Alternative Price Action: Buy pivot looks for a further upside to 1.04970 & 1.05210.
Comment: RSI is below 50 levels and pairs below its 20MA & 55MA.
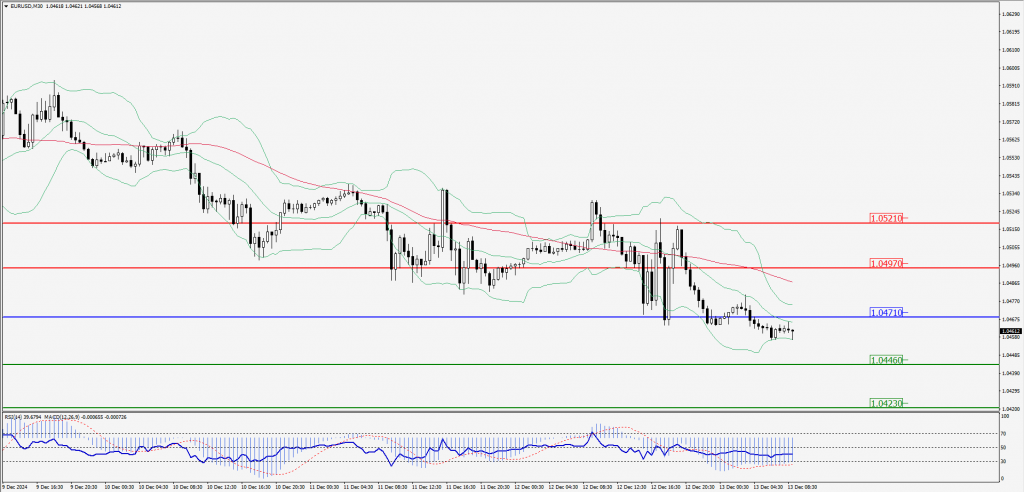
Green Lines Indicate Resistance Levels – Red Lines Indicate Support Levels
Light Blue is a Pivot Point – Black represents the price when the report was produced
GBP/USD Intraday: Major trend on the downside
Our pivot point is at 1.26700
Preferable Price Action: Sell positions below pivot with targets at 1.26420 & 1.26200 in extension.
Alternative Price Action: The price above pivot would call for further upside to 1.26980 & 1.27220.
Comment: RSI is below 50 levels and pairs below its 20MA & 55MA.
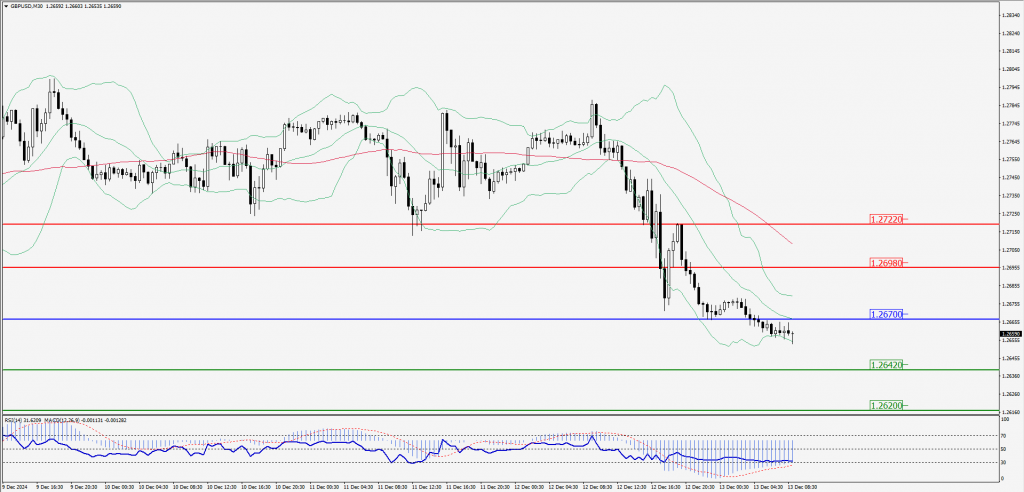
Green Lines Indicate Resistance Levels – Red Lines Indicate Support Levels
Light Blue is a Pivot Point – Black represents the price when the report was produced
USD/JPY Intraday: Trend on the upside
Our pivot point is at 152.770
Preferable Price Action: Buy position above pivot with the target at 153.270 and 153.690 in extension.
Alternative Price Action: The downside breakout of the pivot would call for 152.270 and 151.850.
Comment: MACD is above 50 levels and pairs above its 55MA & 20MA.
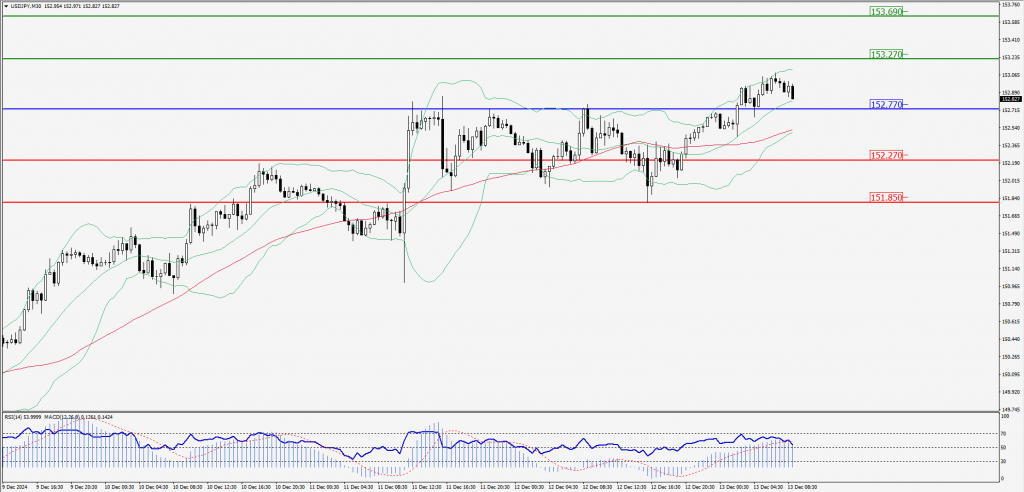
Green Lines Indicate Resistance Levels – Red Lines Indicate Support Levels
Light Blue is a Pivot Point – Black represents the price when the report was produced
AUD/USD Intraday: Trend on the downside
Our pivot point is at 0.63620
Preferable Price Action: Sell positions below pivot with targets at 0.63430 & 0.63280 in extension.
Alternative Price Action: Above pivot a further upside with 0.63810 & 0.63980 as targets.
Comment: RSI is below 50 levels and pairs below its 55MA & 20MA.
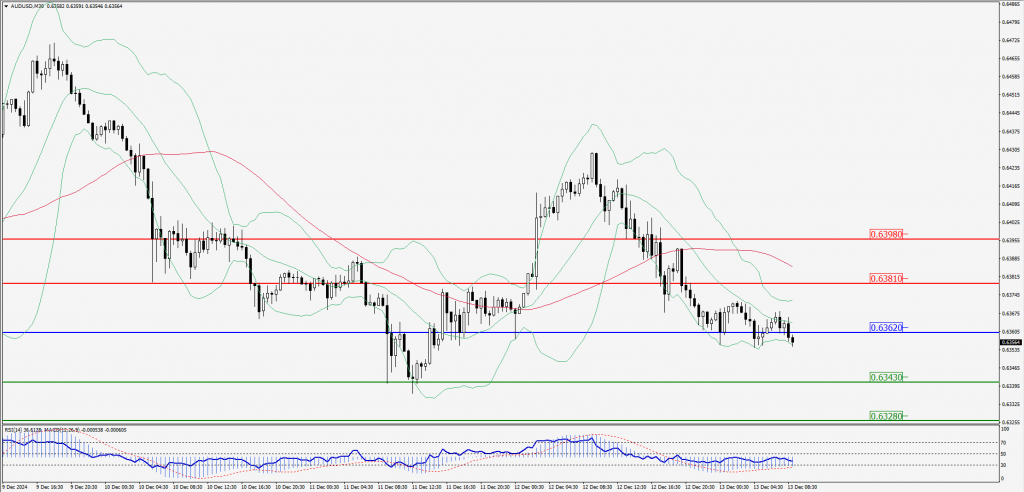
Green Lines Indicate Resistance Levels – Red Lines Indicate Support Levels
Light Blue is a Pivot Point – Black represents the price when the report was produced
CRUDEOIL Intraday: Trend on the upside
Our pivot point is at 69.64
Preferable Price Action: Above pivot buy oil with 70.03 & 70.41 as targets.
Alternative Price Action: Sell crude below pivot with targets at 69.25 & 68.88 in extension.
Comment: RSI is at above 50 levels.
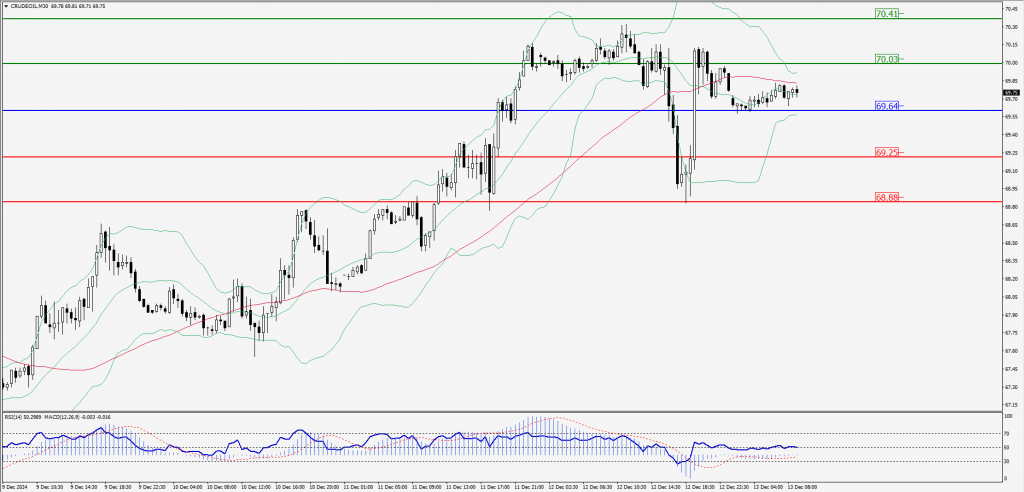
Green Lines Indicate Resistance Levels – Red Lines Indicate Support Levels
Light Blue is a Pivot Point – Black represents the price when the report was produced
XAU/USD Intraday: Trend on the downside
Our pivot point is at 2692.70
Preferable Price Action: Further downside to 2679.90 and 2667.60.
Alternative Price Action: If the price gives an upside breakout of a pivot, then the price extends to 2705.90 and 2718.00.
Comment: MACD is below 50 levels and pairs below its 55MA.
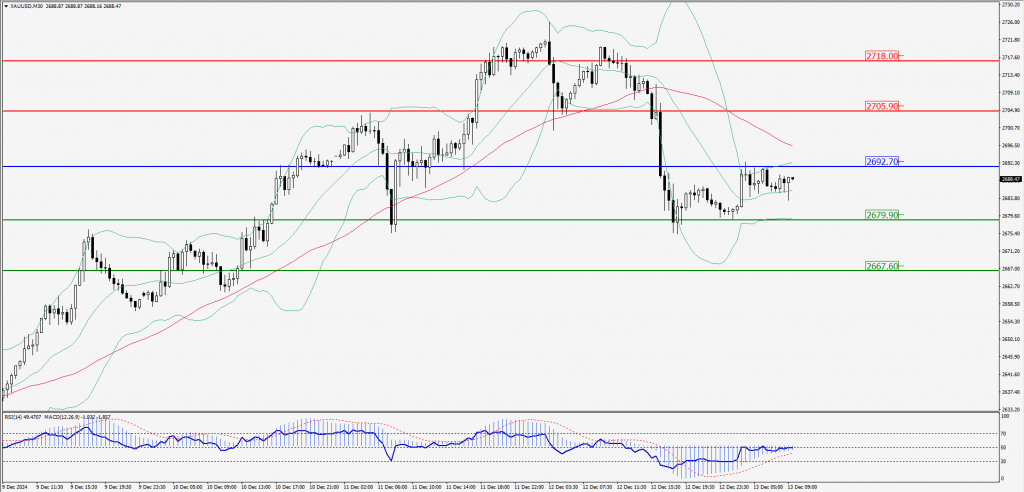
Green Lines Indicate Resistance Levels – Red Lines Indicate Support Levels
Light Blue is a Pivot Point – Black represents the price when the report was produced
Dow Jones Intraday: Trend on the downside
Our pivot point is 44,002.80
Preferable Price Action: Take sell positions below the pivot with targets at 43,846.70 & 43,710.10.
Alternative Price Action: Above 44,002.80 looks for further upside to 44,157.30 & 44,305.30.
Comment: RSI is below 50 levels and pairs below its 55MA.
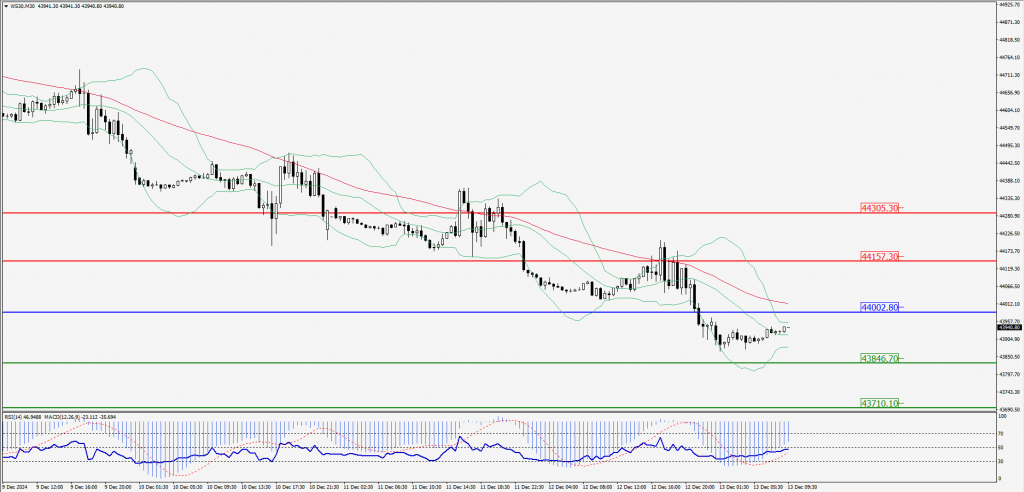
Green Lines Indicate Resistance Levels – Red Lines Indicate Support Levels
Light Blue is a Pivot Point – Black represents the price when the report was produced