Market Wrap: Stocks, Bonds, Commodities
Stock futures are near flat Wednesday night as investors came off a losing session that marked the latest leg down in an August slump.
The Dow Jones Industrial Average fell 361.24 points to 34,946.39, the S&P 500 lose 1.16% to 4,437.86 and the Nasdaq Composite subtract 157.28 points to 13,631.05.
MSCI’s index of Asia-Pacific stocks outside Japan is decline 0.83% to 618.03 levels. The Australian index was lower by 1.50% to 7,195.20. Japanese Nikkei Index drop 1.39% today.
European stocks were positive on Wednesday, with the Stoxx Europe 50 Index rose 0.24% to 4,297.25, Germany’s DAX ascend 0.17% to 15,794.95, and France’s CAC advance 0.34% to 7,292.71 and U.K.’s FTSE 100 subtract 0.10% to 7,382.25.
Benchmark 10-year U.S. Treasury fell as demand for safe assets ascend again, today 10-year bond yields negative 0.80% to 4.1900.
Oil prices fell over 1 percent on Tuesday on sluggish Chinese economic data coupled with fears that Beijing’s unexpected cut in key policy rates was not sufficiently substantial to rejuvenate the country’s sputtering post-pandemic recovery.
Spot Brent crude oil drop 0.16% to $84.75 per barrel. US West Texas Intermediate crude is down 0.16% to $80.87 a barrel.
The yellow metal gold is advance 0.04% to 1,936.05 dollars per ounce.
Market Wrap: Forex
The U.S. dollar rose in early European trade Wednesday, trading near a five-week high on concerns the Federal Reserve could keep raising interest rates, while property sector concerns weighed on the Chinese yuan.
Today, the U.S. dollar index measures the Greenback against a trade-weighted basket of six major currencies, which slipped 0.22% to 102.870.
The Euro US Dollar (EUR/USD) is a widely traded pair that is up 0.20% today. This left the pair trading around $1.09260.
The Japanese yen was negative against the U.S. dollar on Tuesday. Today USD/JPY is slipped 0.02% to the 145.540 level.
Another commodity-related currency positive against the U.S dollar, AUD/USD rose 0.31% to 0.64740, and NZD/USD surged 0.64% to 0.59870 level.
EUR/USD Intraday: Support level at 1.09040
Our pivot point is at 1.09040
Preferable Price Action: Take buy positions above pivot level with targets at 1.09600 & 1.09990 in extension.
Alternative Price Action: Below pivot looks for a further downside to 1.08610 & 1.08320.
Comment: RSI is above 50 levels and Pairs above 20MA.
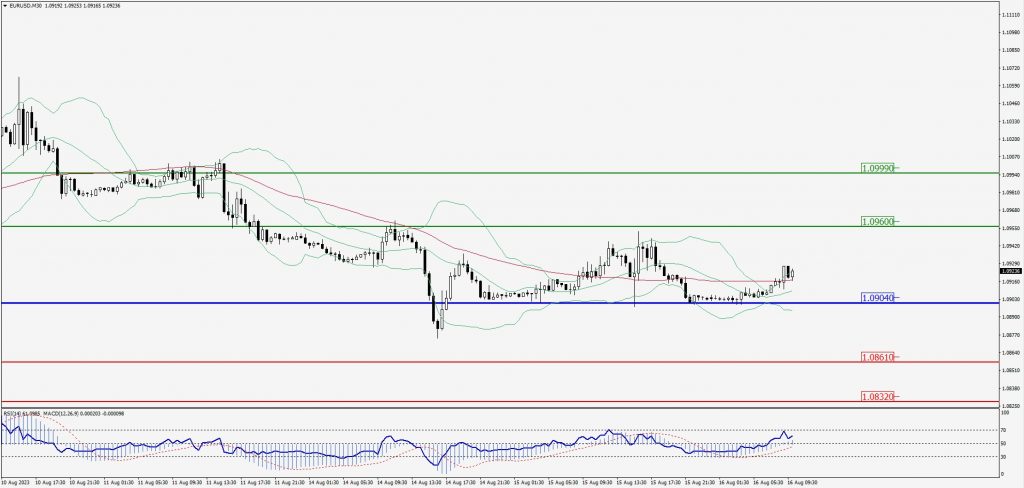
Green Lines Indicate Resistance Levels – Red Lines Indicate Support Levels
Light Blue is a Pivot Point – Black represents the price when the report was produced
GBP/USD Intraday: Major trend on the upside
Our pivot point is at 1.27150
Preferable Price Action: Buy positions above pivot with targets at 1.27600 & 1.27900 in extension.
Alternative Price Action: The price below pivot would call for further downside to 1.26760 & 1.26470.
Comment: RSI is above 50 levels and Pairs above its 20MA & 55MA.
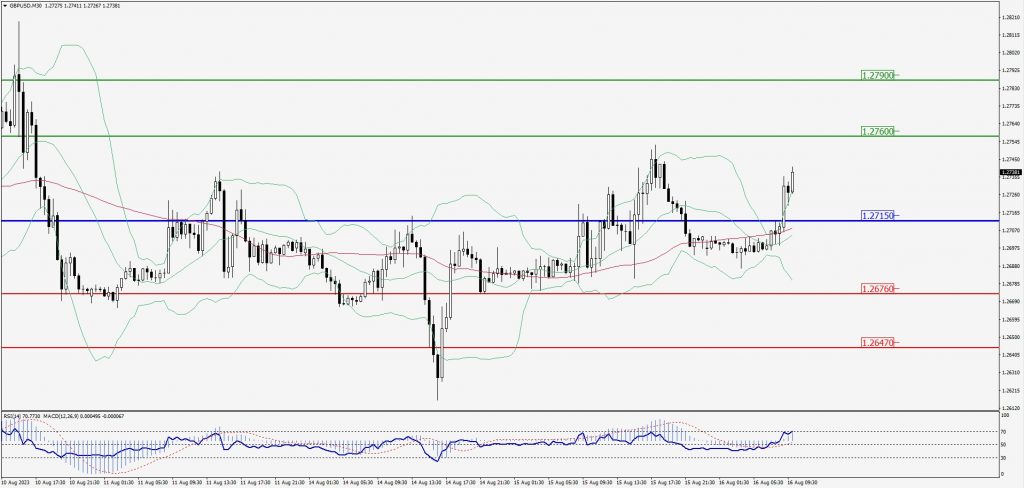
Green Lines Indicate Resistance Levels – Red Lines Indicate Support Levels
Light Blue is a Pivot Point – Black represents the price when the report was produced
USD/JPY Intraday: Resistance level at 145.670
Our pivot point is at 145.670
Preferable Price Action: Sell position below pivot with the target at 146.190 and 146.580 in extension.
Alternative Price Action: The downside breakout of the pivot would call for 145.060 and 144.640.
Comment: MACD is below 50 level and Pairs below its 20MA & 55MA.
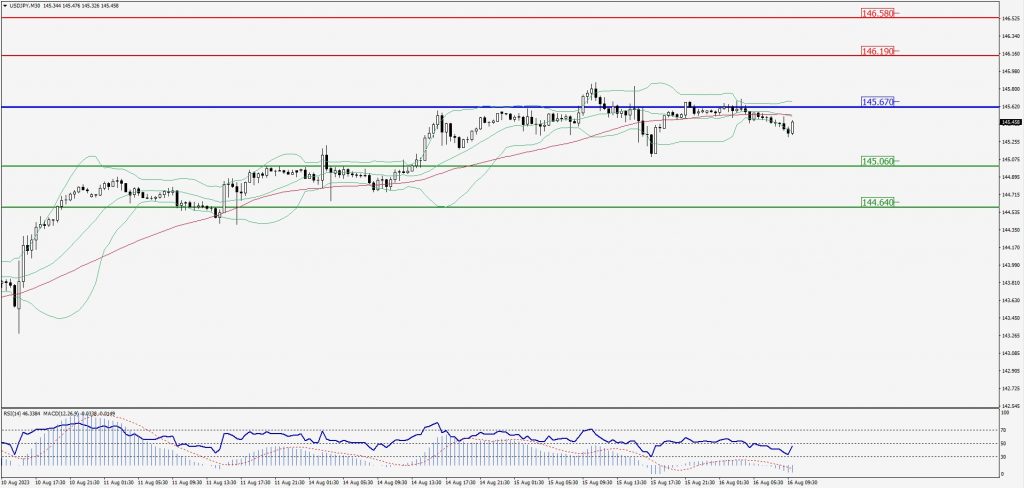
Green Lines Indicate Resistance Levels – Red Lines Indicate Support Levels
Light Blue is a Pivot Point – Black represents the price when the report was produced
AUD/USD Intraday: Trend on the upside
Our pivot point is at 0.64570
Preferable Price Action: Buy positions above pivot with targets at 0.65150 & 0.65520 in extension.
Alternative Price Action: Below pivot looks for a further downside with 0.64040 & 0.63700 as targets.
Comment: RSI is above 50 levels and Pairs above 20MA.
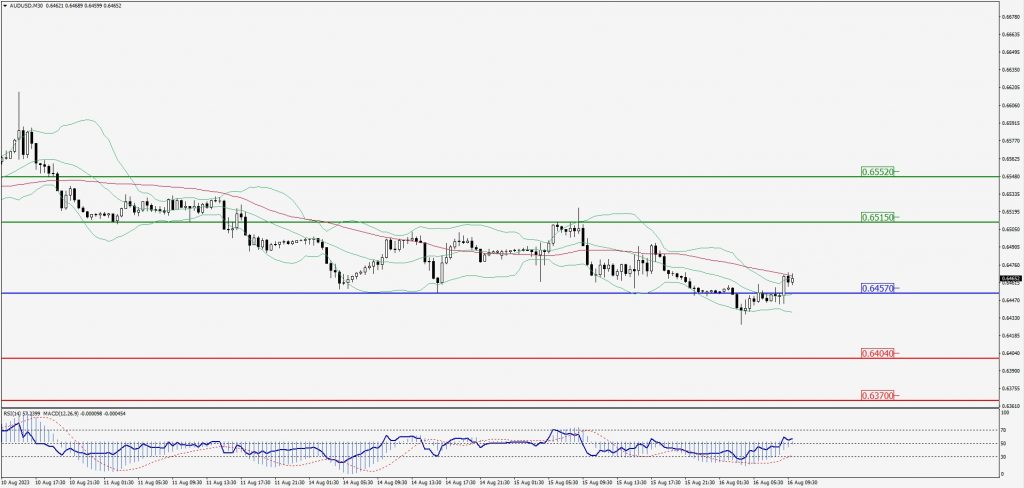
Green Lines Indicate Resistance Levels – Red Lines Indicate Support Levels
Light Blue is a Pivot Point – Black represents the price when the report was produced
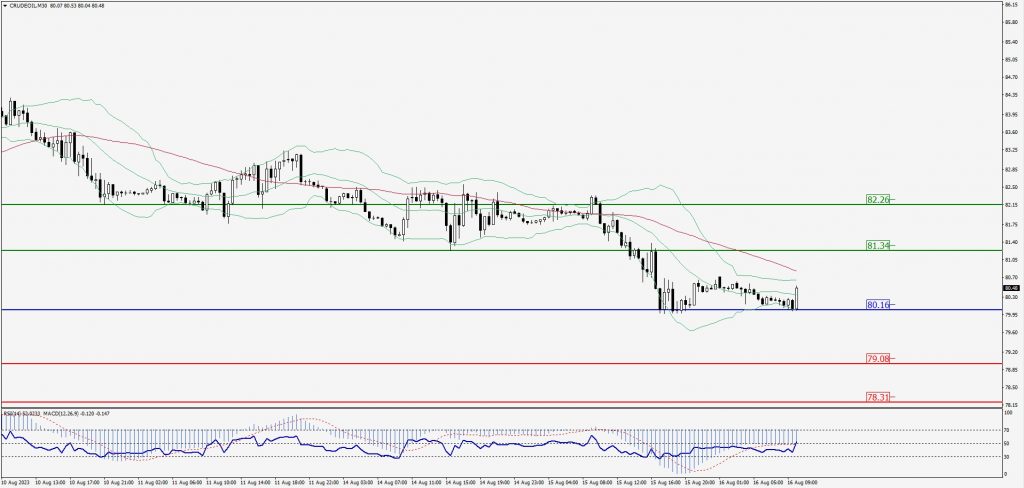
CRUDEOIL Intraday: Support level at 80.16
Our pivot point is at 80.16
Preferable Price Action: Above pivot buy oil with 81.34 & 82.26 as targets.
Alternative Price Action: Sell crude below pivot with targets at 79.08 and 78.311 in extension.
Comment: MACD is positive territory and Pairs above 20MA.
Green Lines Indicate Resistance Levels – Red Lines Indicate Support Levels
Light Blue is a Pivot Point – Black represents the price when the report was produced
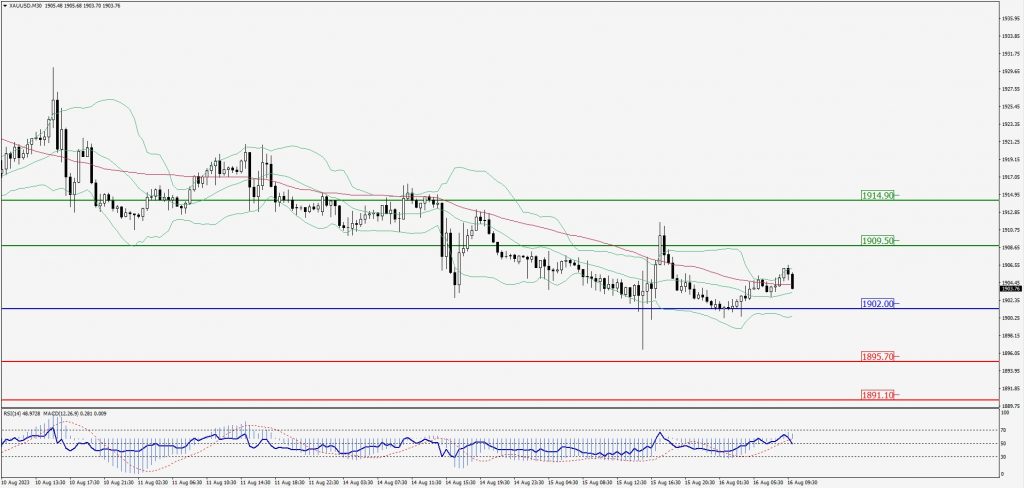
XAU/USD Intraday: In a consolidation zone
Our pivot point is 1902.00
Preferable Price Action: Further upside to 1909.50 and 1914.90.
Alternative Price Action: If the price gives a downside breakout of a pivot, then the price extends to 1895.70 and 1891.10.
Comment: MACD is above 50 level and Pairs above 20MA.
Green Lines Indicate Resistance Levels – Red Lines Indicate Support Levels
Light Blue is a Pivot Point – Black represents the price when the report was produced
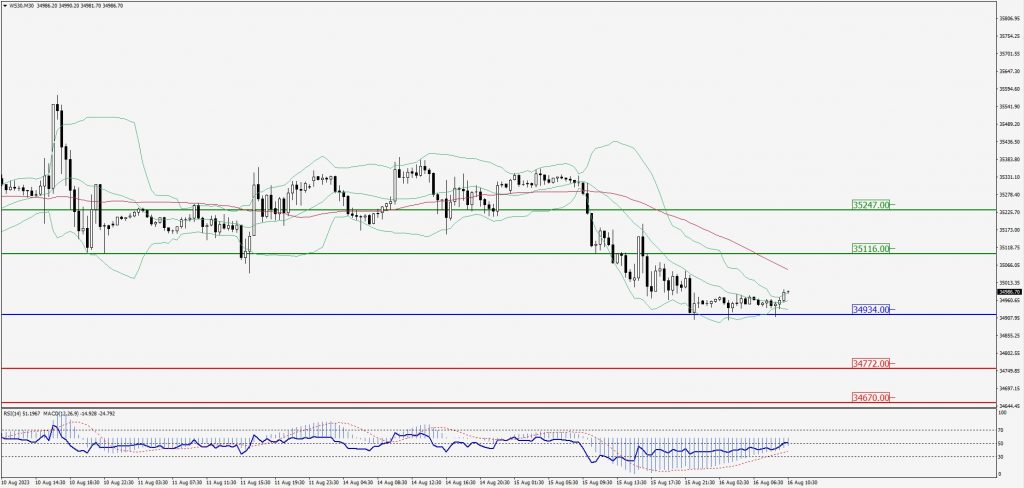
Dow Jones Intraday: Trend on the upside
Our pivot point is 34,934.00
Preferable Price Action: Take buy positions above the pivot with targets at 35,116.00 & 35,247.00.
Alternative Price Action: Below 34,934.00 looks for further downside to 34,772.00 & 34,670.00.
Comment: RSI is above 50 levels and Pairs above 20MA.
Green Lines Indicate Resistance Levels – Red Lines Indicate Support Levels
Light Blue is a Pivot Point – Black represents the price when the report was produced