Market Wrap: Stocks, Bonds, Commodities
The S&P 500 and the Nasdaq closed higher on Monday as shares of chipmaker Nvidia surged following a bullish note from Morgan Stanley , leading gains in other mega cap growth stocks.
The Dow Jones Industrial Average rose 26.23 points to 35,307.63, the S&P 500 gain 0.57% to 4,489.72 and the Nasdaq Composite add 143.48 points to 13,788.33.
MSCI’s index of Asia-Pacific stocks outside Japan is decline 0.41% to 624.07 levels. The Australian index was higher by 0.38% to 7,305.00. Japanese Nikkei Index ascend 0.49% today.
European stocks were mixed on Tuesday, with the Stoxx Europe 50 Index rose 0.05% to 4,332.45, Germany’s DAX drop 0.05% to 15,896.44, and France’s CAC decline 0.02% to 7,347.63 and U.K.’s FTSE 100 subtract 0.33% to 7,482.93.
Benchmark 10-year U.S. Treasury fell as demand for safe assets ascend again, today 10-year bond yields positive 0.74% to 4.2160.
Oil prices edged higher on Tuesday as China unexpectedly cut key policy rates for the second time in three months to shore up a sputtering economic recovery, although sluggish economic out of Beijing put a lid on gains.
Spot Brent crude oil ascend 0.20% to $86.38 per barrel. US West Texas Intermediate crude is up 0.13% to $82.61 a barrel.
The yellow metal gold is decline 0.41% to 1,936.15 dollars per ounce.
Market Wrap: Forex
The U.S. dollar edged lower in early European trade Tuesday, but remained near recent highs, while the Chinese yuan saw volatile trading after the country’s central bank unexpectedly cut key policy rates.
Today, the U.S. dollar index measures the Greenback against a trade-weighted basket of six major currencies, which slipped 0.12% to 102.920.
The Euro US Dollar (EUR/USD) is a widely traded pair that is up 0.20% today. This left the pair trading around $1.09260.
The Japanese yen was negative against the U.S. dollar on Tuesday. Today USD/JPY is surged 0.13% to the 145.730 level.
Another commodity-related currency positive against the U.S dollar, AUD/USD rose 0.11% to 0.64910, and NZD/USD surged 0.13% to 0.59810 level.
EUR/USD Intraday: Support level at 1.09080
Our pivot point is at 1.09080
Preferable Price Action: Take buy positions above pivot level with targets at 1.09600 & 1.10000 in extension.
Alternative Price Action: Below pivot looks for a further downside to 1.08620 & 1.08310.
Comment: RSI is above 50 levels and Pairs above 20MA.
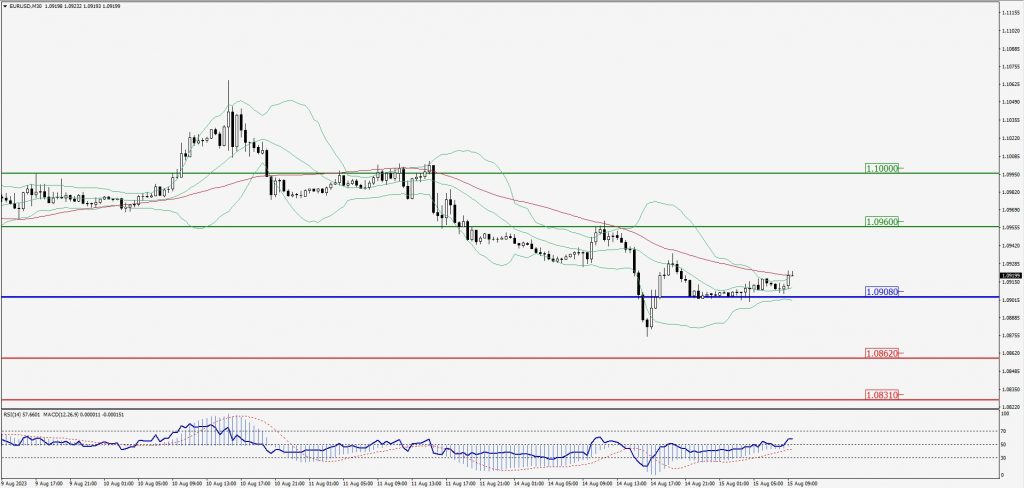
Green Lines Indicate Resistance Levels – Red Lines Indicate Support Levels
Light Blue is a Pivot Point – Black represents the price when the report was produced
GBP/USD Intraday: Trend on the upside
Our pivot point is at 1.26930
Preferable Price Action: Buy positions above pivot with targets at 1.27430 & 1.27760 in extension.
Alternative Price Action: The price below pivot would call for further downside to 1.26520 & 1.26210.
Comment: RSI is above 50 levels and Pairs above its 20MA & 55MA.
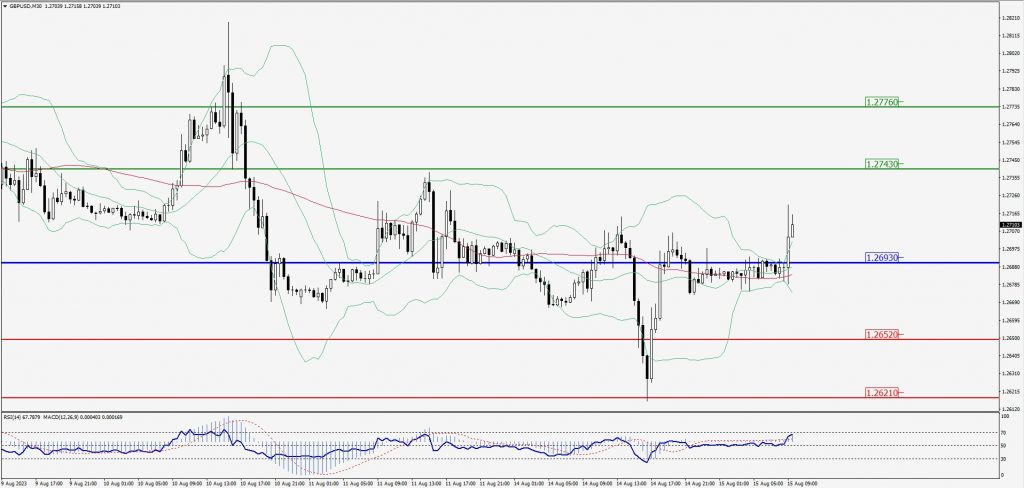
Green Lines Indicate Resistance Levels – Red Lines Indicate Support Levels
Light Blue is a Pivot Point – Black represents the price when the report was produced
USD/JPY Intraday: Major trend on the upside
Our pivot point is at 145.480
Preferable Price Action: Buy position above pivot with the target at 146.110 and 146.480 in extension.
Alternative Price Action: The downside breakout of the pivot would call for 144.900 and 144.510.
Comment: MACD is above 50 level and Pairs above its 20MA & 55MA.
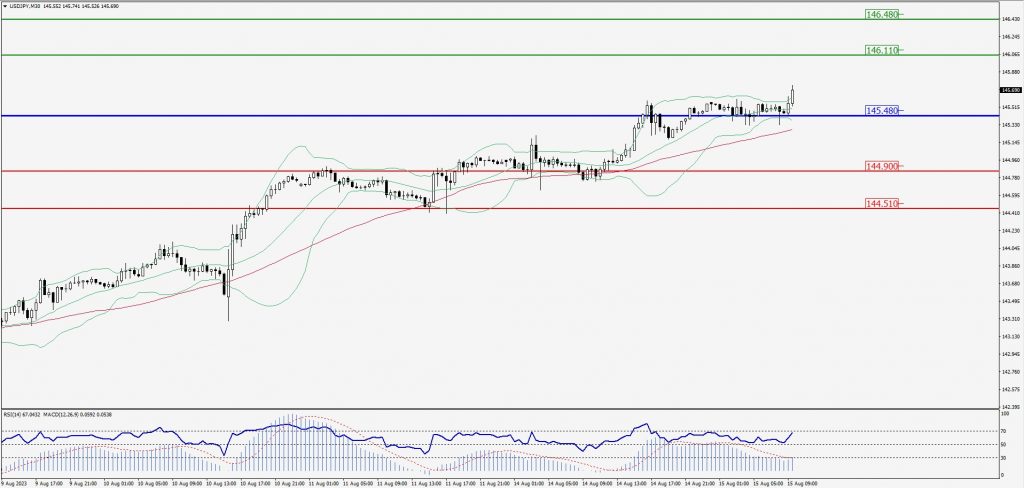
Green Lines Indicate Resistance Levels – Red Lines Indicate Support Levels
Light Blue is a Pivot Point – Black represents the price when the report was produced
AUD/USD Intraday: Trend on the upside
Our pivot point is at 0.64910
Preferable Price Action: Buy positions above pivot with targets at 0.65280 & 0.65520 in extension.
Alternative Price Action: Below pivot looks for a further downside with 0.64560 & 0.64350 as targets.
Comment: RSI is above 50 levels and Pairs above 55MA.
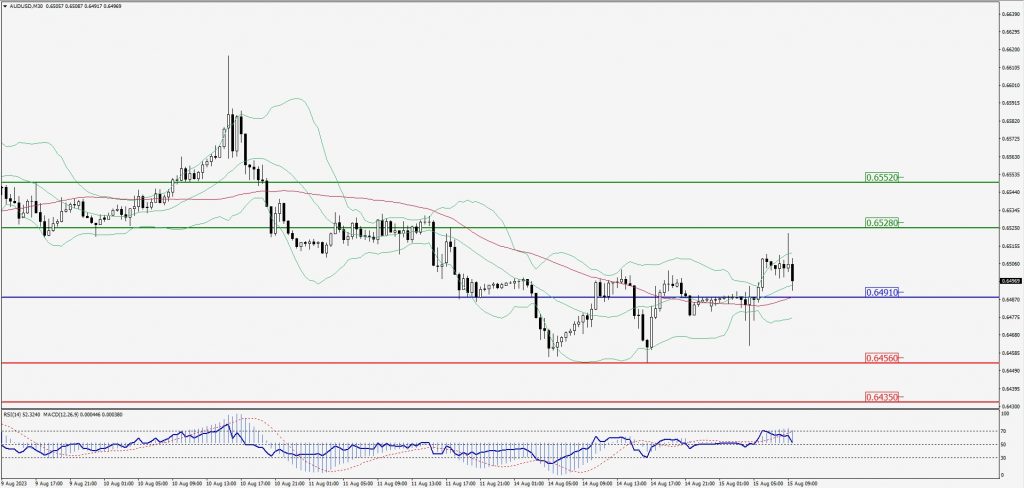
Green Lines Indicate Resistance Levels – Red Lines Indicate Support Levels
Light Blue is a Pivot Point – Black represents the price when the report was produced
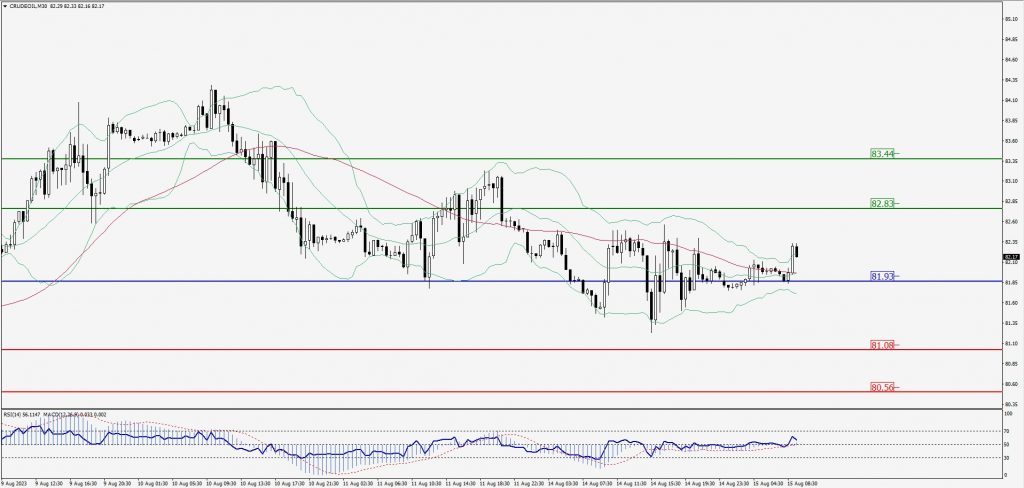
CRUDEOIL Intraday: Support level at 81.93
Our pivot point is at 81.93
Preferable Price Action: Above pivot buy oil with 82.83 & 83.44 as targets.
Alternative Price Action: Sell crude below pivot with targets at 81.08 and 80.56 in extension.
Comment: MACD is positive territory and Pairs above its 20MA & 55MA.
Green Lines Indicate Resistance Levels – Red Lines Indicate Support Levels
Light Blue is a Pivot Point – Black represents the price when the report was produced
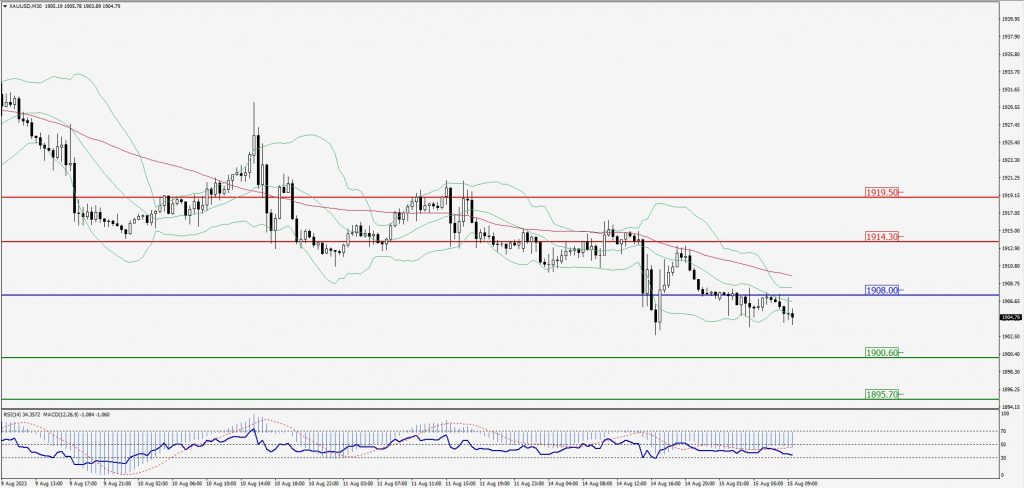
XAU/USD Intraday: Trend on the downside
Our pivot point is 1908.00
Preferable Price Action: Further downside to 1900.60 and 1895.70.
Alternative Price Action: If the price gives an upside breakout of a pivot, then the price extends to 1914.30 and 1919.50.
Comment: MACD is below 50 level and Pairs below its 20MA & 55MA.
Green Lines Indicate Resistance Levels – Red Lines Indicate Support Levels
Light Blue is a Pivot Point – Black represents the price when the report was produced
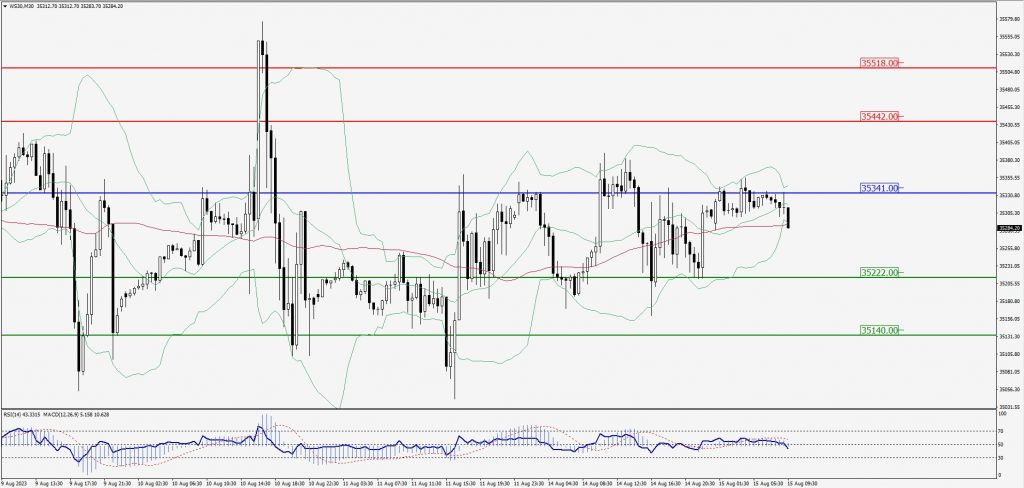
Dow Jones Intraday: Resistance level at 35,341.00
Our pivot point is 35,341.00
Preferable Price Action: Take sell positions below the pivot with targets at 35,222.00 & 35,140.00.
Alternative Price Action: Above 35,341.00 looks for further upside to 35,442.00 & 35,518.00.
Comment: RSI is below 50 levels and Pairs below 20MA.
Green Lines Indicate Resistance Levels – Red Lines Indicate Support Levels
Light Blue is a Pivot Point – Black represents the price when the report was produced