Market Wrap: Stocks, Bonds, Commodities
Stock futures were near flat on Wednesday night as investors digested the Federal Reserve’s latest commentary that future rate hikes are not out of the picture.
The Dow Jones Industrial Average fell 180.65 points to 34,765.74, the S&P 500 lose 0.76% to 4,404.33 and the Nasdaq Composite subtract 156.42 points to 13,474.63.
MSCI’s index of Asia-Pacific stocks outside Japan is flat 0.01% to 618.34 levels. The Australian index was lower by 0.68% to 7,146.00. Japanese Nikkei Index drop 0.61% today.
European stocks were negative on Thursday, with the Stoxx Europe 50 Index fell 0.35% to 4,270.15, Germany’s DAX drop 0.10% to 15,778.75, and France’s CAC decline 0.18% to 7,247.04 and U.K.’s FTSE 100 subtract 0.28% to 7,336.62.
Benchmark 10-year U.S. Treasury fell as demand for safe assets ascend again, today 10-year bond yields positive 0.70% to 4.2880.
Oil prices were little changed on Wednesday as investors weighed worries about China’s embattled economy against expectations of tighter supply in the United States.
Spot Brent crude oil ascend 0.26% to $83.67 per barrel. US West Texas Intermediate crude is up 0.25% to $79.60 a barrel.
The yellow metal gold is decline 0.16% to 1,925.85 dollars per ounce.
Market Wrap: Forex
The U.S. dollar edged lower in early European trade Thursday but remains trading near two-month highs after the minutes from the last Federal Reserve meeting offered a hawkish slant.
Today, the U.S. dollar index measures the Greenback against a trade-weighted basket of six major currencies, which slipped 0.02% to 103.320.
The Euro US Dollar (EUR/USD) is a widely traded pair that is up 0.05% today. This left the pair trading around $1.08780.
The Japanese yen was negative against the U.S. dollar on Thursday. Today USD/JPY is slipped 0.13% to the 146.150 level.
Another commodity-related currency negative against the U.S dollar, AUD/USD fell 0.31% to 0.64030, and NZD/USD slipped 0.05% to 0.59320 level.
EUR/USD Intraday: Trend on the upside
Our pivot point is at 1.08760
Preferable Price Action: Take buy positions above pivot level with targets at 1.09210 & 1.09570 in extension.
Alternative Price Action: Below pivot looks for a further downside to 1.08330 & 1.08080.
Comment: RSI is above 50 levels and Pairs above 20MA.
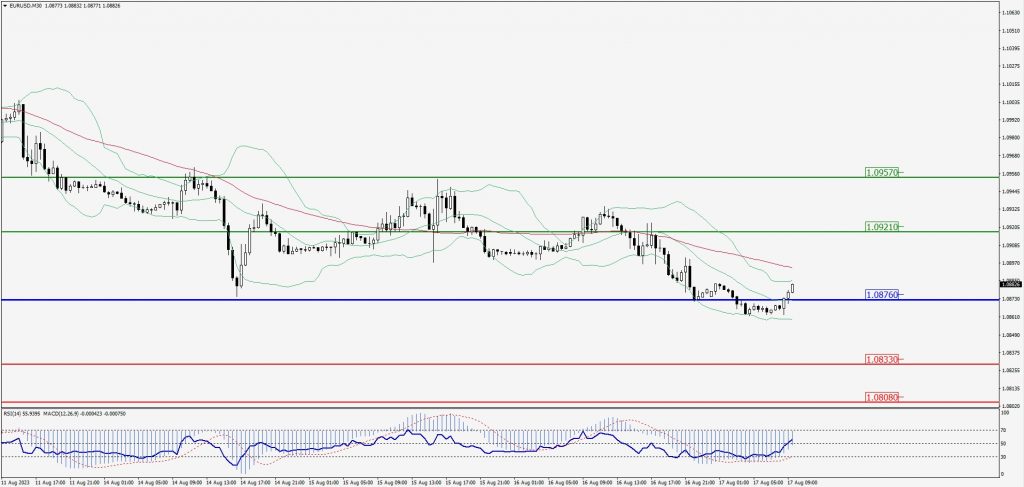
Green Lines Indicate Resistance Levels – Red Lines Indicate Support Levels
Light Blue is a Pivot Point – Black represents the price when the report was produced
GBP/USD Intraday: Trend on the upside
Our pivot point is at 1.27300
Preferable Price Action: Buy positions above pivot with targets at 1.27700 & 1.27970 in extension.
Alternative Price Action: The price below pivot would call for further downside to 1.26920 & 1.26640.
Comment: RSI is above 50 levels and Pairs above its
20MA & 55MA.
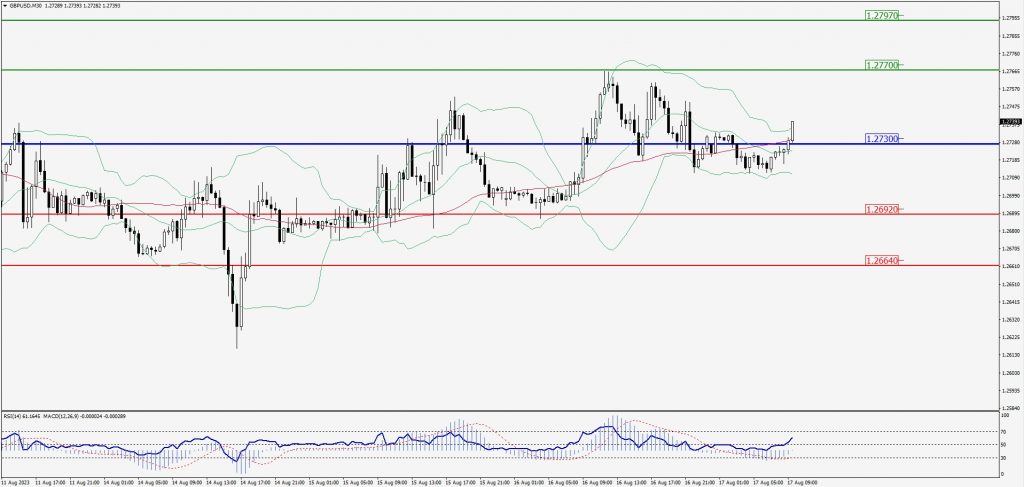
Green Lines Indicate Resistance Levels – Red Lines Indicate Support Levels
Light Blue is a Pivot Point – Black represents the price when the report was produced
USD/JPY Intraday: Trend on the upside
Our pivot point is at 146.190
Preferable Price Action: Buy position abvoe pivot with the target at 146.600 and 146.900 in extension.
Alternative Price Action: The downside breakout of the pivot would call for 145.760 and 145.440.
Comment: MACD is above 50 level and Pairs above 55MA.
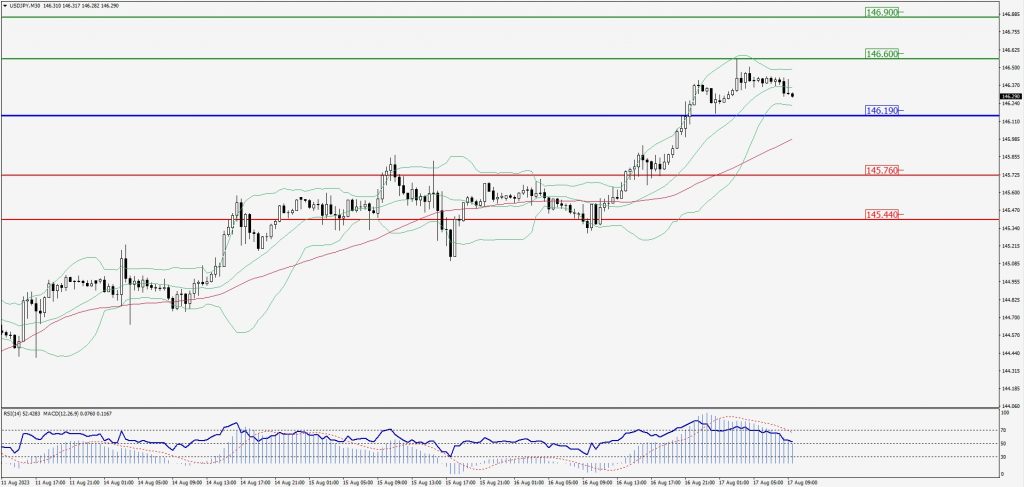
Green Lines Indicate Resistance Levels – Red Lines Indicate Support Levels
Light Blue is a Pivot Point – Black represents the price when the report was produced
AUD/USD Intraday: In a consolidation zone
Our pivot point is at 0.64200
Preferable Price Action: Sell positions below pivot with targets at 0.63800 & 0.63540 in extension.
Alternative Price Action: Above pivot looks for a further upside with 0.64560 & 0.64830 as targets.
Comment: RSI is at 50 levels and Pairs below 55MA.
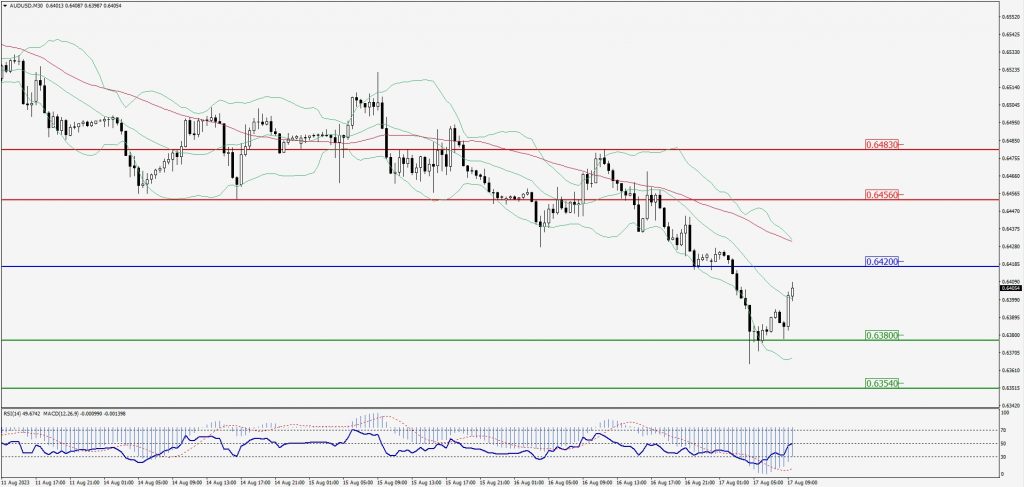
Green Lines Indicate Resistance Levels – Red Lines Indicate Support Levels
Light Blue is a Pivot Point – Black represents the price when the report was produced
CRUDEOIL Intraday: Support level at 78.89
Our pivot point is at 78.89
Preferable Price Action: Above pivot buy oil with 79.92 & 80.65 as targets.
Alternative Price Action: Sell crude below pivot with targets at 77.97 and 77.32 in extension.
Comment: MACD is positive territory and Pairs above 20MA.
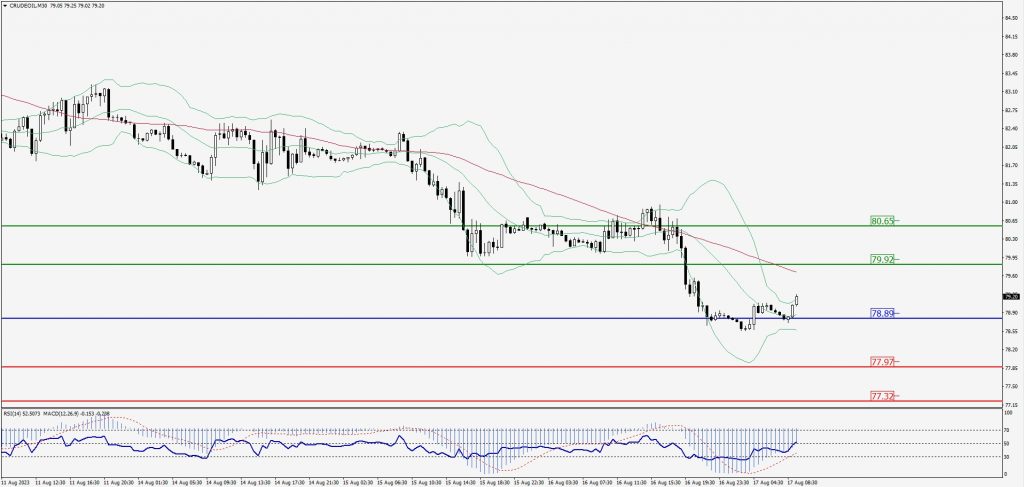
Green Lines Indicate Resistance Levels – Red Lines Indicate Support Levels
Light Blue is a Pivot Point – Black represents the price when the report was produced
XAU/USD Intraday: Trend on the upside
Our pivot point is 1894.90
Preferable Price Action: Further upside to 1901.00 and 1905.20.
Alternative Price Action: If the price gives a downside breakout of a pivot, then the price extends to 1890.00 and 1886.60.
Comment: MACD is above 50 level and Pairs above 20MA.
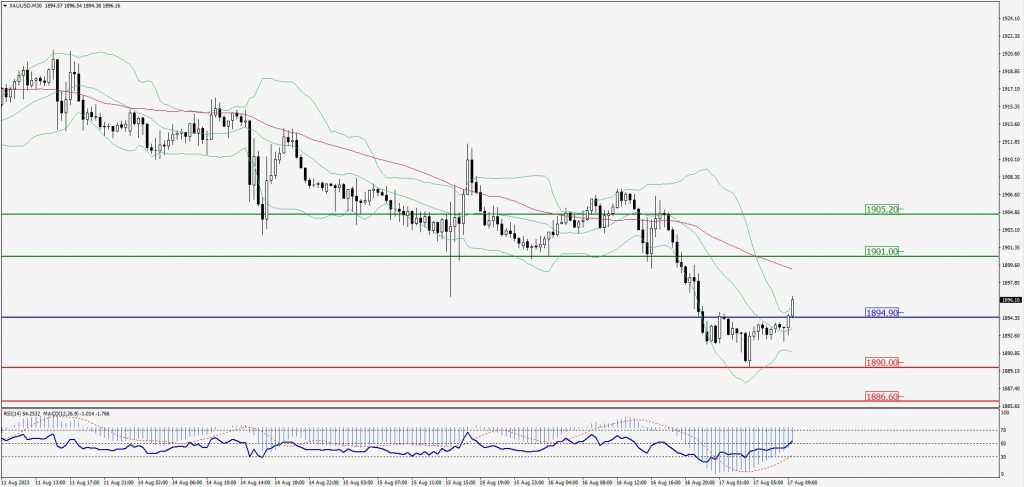
Green Lines Indicate Resistance Levels – Red Lines Indicate Support Levels
Light Blue is a Pivot Point – Black represents the price when the report was produced
Dow Jones Intraday: In a consolidation zone
Our pivot point is 34,883.00
Preferable Price Action: Take sell positions above the pivot with targets at 34,734.00 & 34,640.00.
Alternative Price Action: Above 34,883.00 looks for further upside to 35,010.00 & 35,111.00.
Comment: RSI is at 50 levels and Pairs below 55MA.
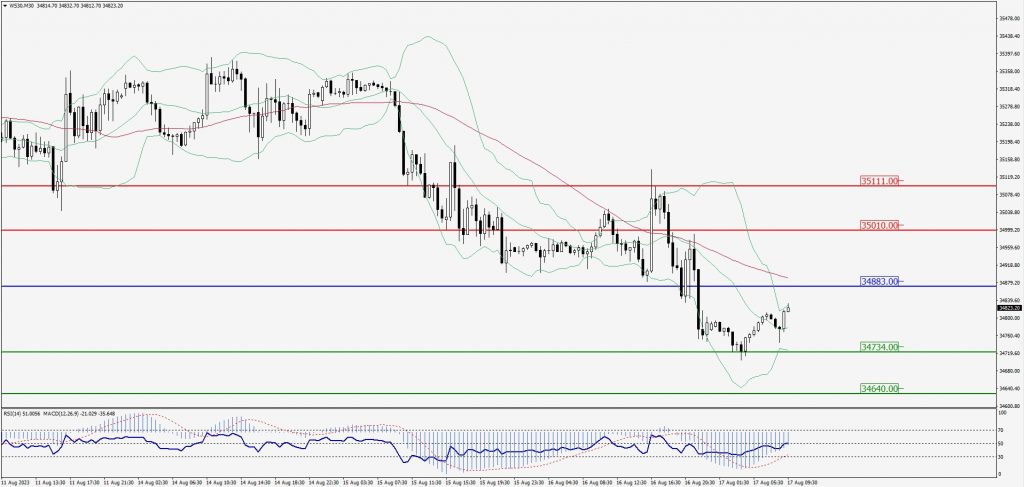
Green Lines Indicate Resistance Levels – Red Lines Indicate Support Levels
Light Blue is a Pivot Point – Black represents the price when the report was produced