Market Wrap: Stocks, Bonds, Commodities
Most Asian currencies moved little on Friday and were nursing losses for the week, while the dollar steadied at a one-year peak and was set for a strong week as markets dialed back bets on lower U.S. interest rates.
The Dow Jones Industrial Average fail 207.33 points to 43,750.86, the S&P 500 loss 0.60% to 5,949.17 and the Nasdaq Composite down 123.07 points to 19,107.65.
MSCI’s index of Asia-Pacific stocks outside Japan is down 0.81% to 705.44 levels. The Australian index was higher by 0.74% to 8,285.20. Japanese Nikkei Index increase 0.35% today.
European stocks were positive on Friday, with the Stoxx Europe 50 Index increase 1.96% to 4,834.05 Germany’s DAX ascend 1.37% to 19.263.70, and France’s CAC higher 1.32% to 7,311.80 and U.K.’s FTSE 100 gain 0.51% to 8,071.19.
Benchmark 10-year U.S. Treasury rose as demand for safe assets slipped again, today 10-year bond yields 0.61% to 4.4490.
Oil prices fell on Friday on signs demand in China, the world’s biggest crude importer, continues to underperform amid its uneven economic recovery.
Spot Brent crude oil decrease 1.31% to $71.61 per barrel. US West Texas Intermediate crude is decrease 1.27% to $67.83 a barrel.
The yellow metal gold is down 0.27% to 2,565.90 dollars per ounce.
Market Wrap: Forex
The dollar was headed for a sixth straight week of gains as it extended its rally on Donald Trump’s election victory from last week. Less dovish statements from the Federal Reserve and strong U.S. inflation readings added to the greenback’s strength.
Today, the U.S. dollar index measures the Greenback against a trade-weighted basket of six major currencies, which either descend 0.03% to 106.570.
The Euro US Dollar (EUR/USD) is a widely traded is up 0.26% today. This left the pair trading around $1.05570.
The Japanese yen was will move negative against the U.S. dollar on Friday. Today USD/JPY is trades pair that decrease 0.19% to the 155.95 level.
Another commodity-related currency positive against the U.S dollar, AUD/USD gain 0.22% to 0.64660, and NZD/USD increase 0.28% to 0.58660 level.
EUR/USD Intraday: Trend on the upside
Our pivot point is at 1.05440
Preferable Price Action: Take buy positions above pivot level with targets at 1.05660 & 1.05880 in extension.
Alternative Price Action: Sell pivot looks for a further downside to 1.05220 & 1.05020.
Comment: RSI is above 50 levels.
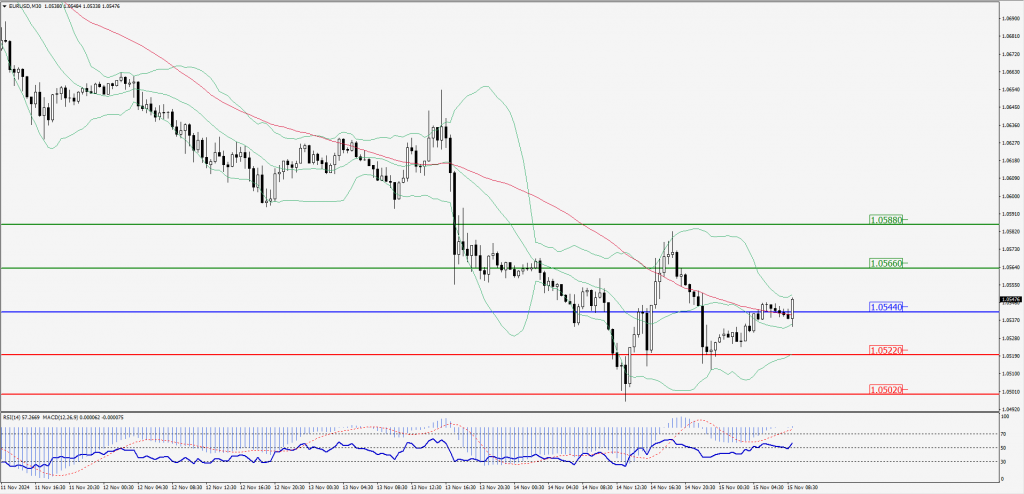
Green Lines Indicate Resistance Levels – Red Lines Indicate Support Levels
Light Blue is a Pivot Point – Black represents the price when the report was produced
GBP/USD Intraday: Trend on the upside
Our pivot point is at 1.26750
Preferable Price Action: Buy positions above pivot with targets at 1.27150 & 1.27530 in extension.
Alternative Price Action: The price below pivot would call for further downside to 1.26360 & 1.26000.
Comment: RSI is above 50 levels.
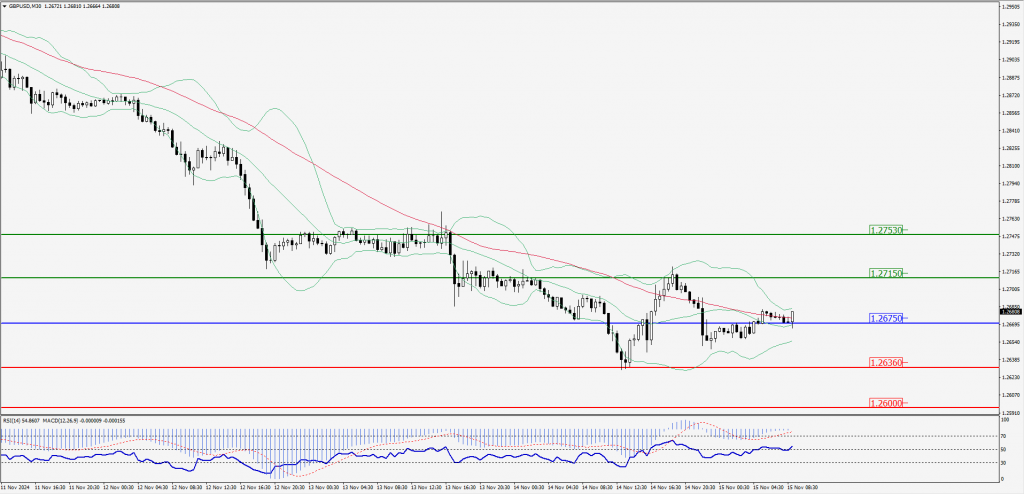
Green Lines Indicate Resistance Levels – Red Lines Indicate Support Levels
Light Blue is a Pivot Point – Black represents the price when the report was produced
USD/JPY Intraday: Trend on the downside
Our pivot point is at 156.320
Preferable Price Action: Sell position below pivot with the target at 155.870 and 155.410 in extension.
Alternative Price Action: The upside breakout of the pivot would call for 156.760 and 157.180.
Comment: MACD is below 50 levels and pairs below its 55MA & 20MA.
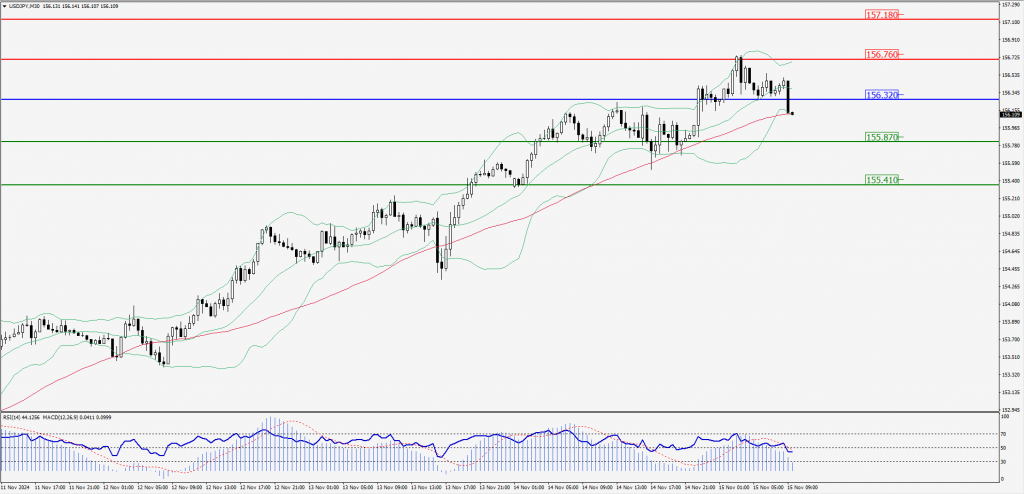
Green Lines Indicate Resistance Levels – Red Lines Indicate Support Levels
Light Blue is a Pivot Point – Black represents the price when the report was produced
AUD/USD Intraday: Trend on the upside
Our pivot point is at 0.64620
Preferable Price Action: Buy positions above pivot with targets at 0.64860 & 0.65080 in extension.
Alternative Price Action: Below pivot a further downside with 0.64380 & 0.64170 as targets.
Comment: RSI is above 50 levels and pairs above its 20MA.
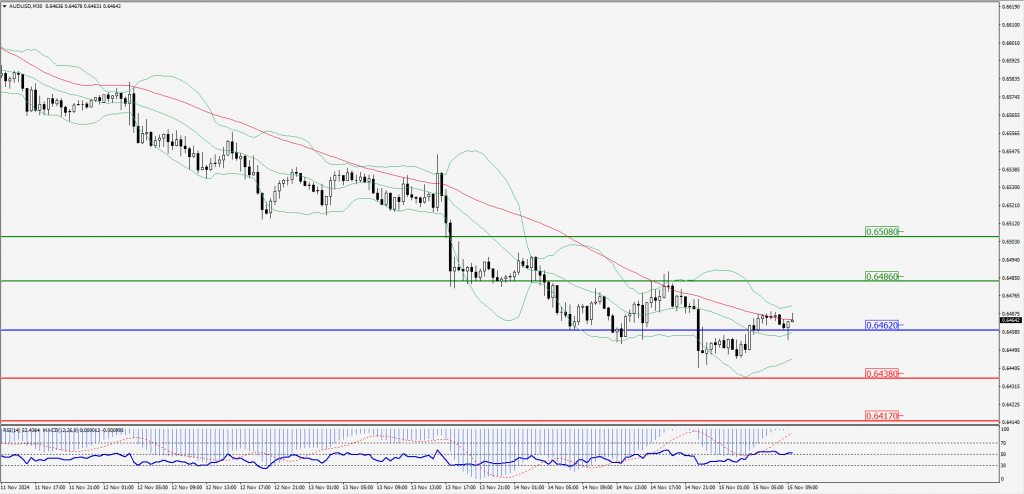
Green Lines Indicate Resistance Levels – Red Lines Indicate Support Levels
Light Blue is a Pivot Point – Black represents the price when the report was produced
CRUDEOIL Intraday: Major trend on the downside
Our pivot point is at 67.91
Preferable Price Action: Below pivot sell oil with 67.46 & 67.11 as targets.
Alternative Price Action: Buy crude above pivot with targets at 68.33 & 68.72 in extension.
Comment: RSI is at below 50 levels and pairs below its 20MA & 55MA.
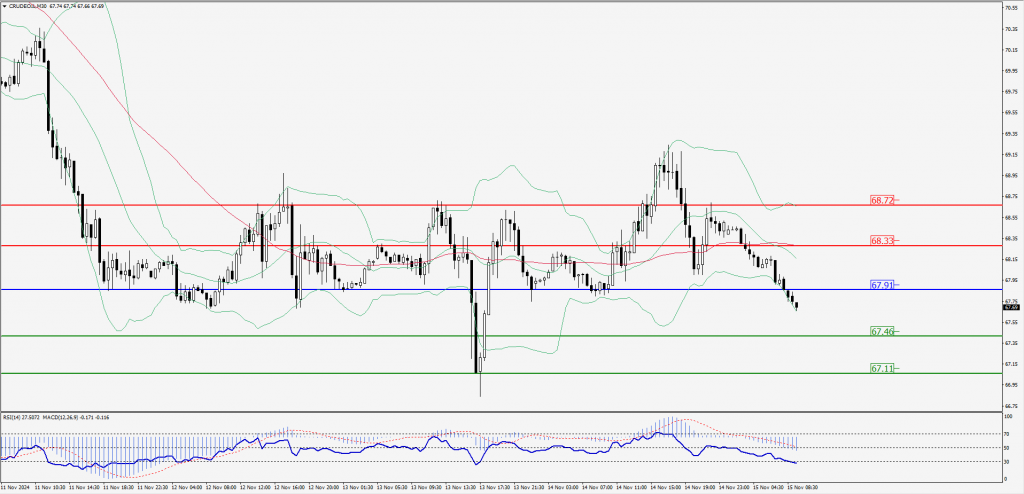
Green Lines Indicate Resistance Levels – Red Lines Indicate Support Levels
Light Blue is a Pivot Point – Black represents the price when the report was produced
XAU/USD Intraday: Trend on the downside
Our pivot point is at 2568.40
Preferable Price Action: Further downside to 2552.40 and 2538.20.
Alternative Price Action: If the price gives an upside breakout of a pivot, then the price extends to 2584.90 and 2599.30.
Comment: MACD is below 50 levels and pairs below its 20MA.
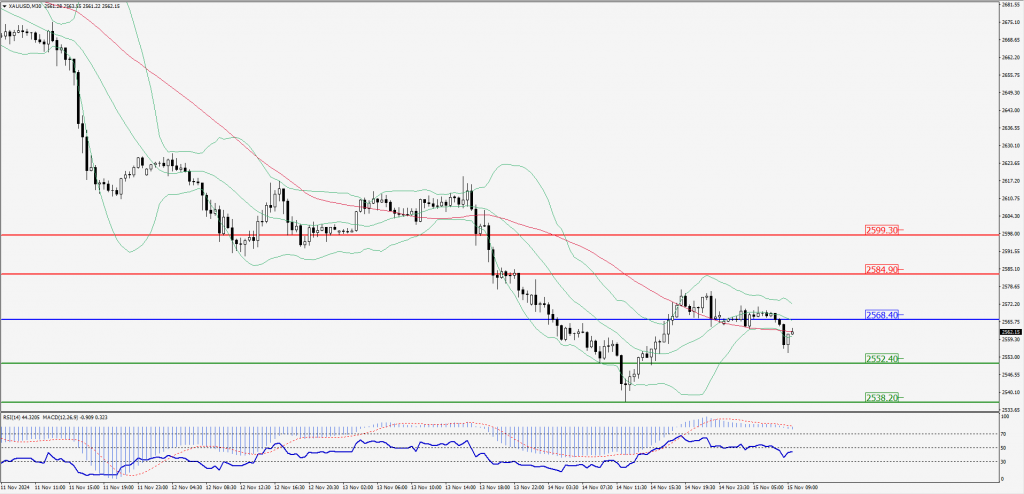
Green Lines Indicate Resistance Levels – Red Lines Indicate Support Levels
Light Blue is a Pivot Point – Black represents the price when the report was produced
Dow Jones Intraday: Major trend on the downside
Our pivot point is 43,638.30
Preferable Price Action: Take sell positions below the pivot with targets at 43,478.50 & 43,336.00.
Alternative Price Action: Above 43,638.30 looks for further upside to 43,794.20 & 43,929.00.
Comment: RSI is below 50 levels and pairs below its 20MA & 55MA.
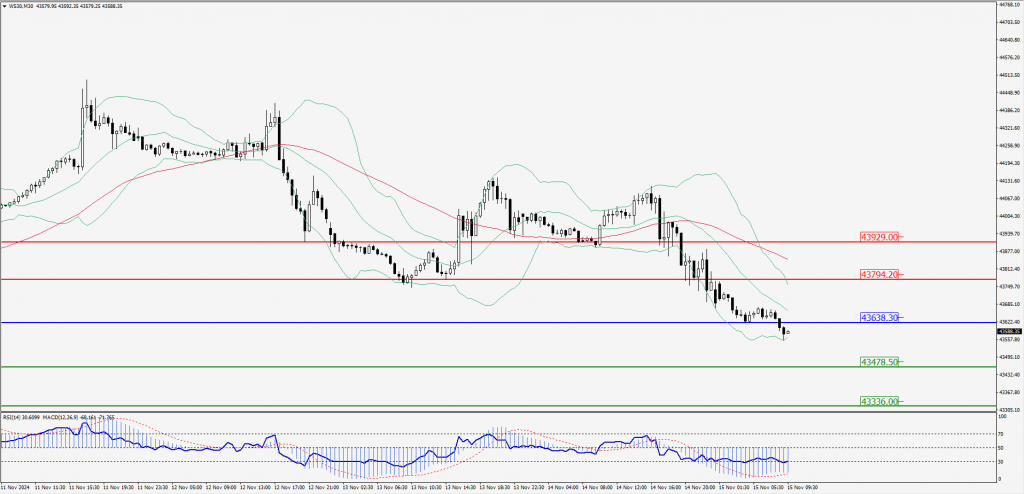
Green Lines Indicate Resistance Levels – Red Lines Indicate Support Levels
Light Blue is a Pivot Point – Black represents the price when the report was produced