Market Wrap: Stocks, Bonds, Commodities
Wall Street’s main indexes closed lower on Friday, with the S&P 500 and Nasdaq notching their biggest one-day losses in two weeks. This was due to concerns about slower interest-rate cuts and investors’ reactions to U.S. President-elect Donald Trump’s cabinet picks.
The Dow Jones Industrial Average fail 305.87 points to 43,444.99, the S&P 500 loss 1.32% to 5,870.62 and the Nasdaq Composite down 427.53 points to 18,680.12.
MSCI’s index of Asia-Pacific stocks outside Japan is up 0.41% to 707.23 levels. The Australian index was higher by 0.18% to 8,300.20. Japanese Nikkei Index decrease 1.05% today.
European stocks were negative on Monday, with the Stoxx Europe 50 Index decrease 0.79% to 4,795.35 Germany’s DAX descend 0.27% to 19.210.81, and France’s CAC lower 0.58% to 7,269.63 and U.K.’s FTSE 100 loss 0.09% to 8,063.61.
Benchmark 10-year U.S. Treasury rose as demand for safe assets slipped again, today 10-year bond yields 0.16% to 4.4360.
Oil prices edged up on Monday after fighting between Russia and Ukraine intensified over the weekend, although concerns about fuel demand in China, the world’s second-largest consumer, and forecasts of a global oil surplus weighed on markets.
Spot Brent crude oil increase 0.31% to $71.26 per barrel. US West Texas Intermediate crude is increase 0.25% to $67.09 a barrel.
The yellow metal gold is up 0.74% to 2,589.15 dollars per ounce.
Market Wrap: Forex
The dollar rose against the yen on Monday after Japan’s top central banker flagged further policy tightening ahead but left open the question of timing, leaving the market no clearer on whether a move would come next month.
Today, the U.S. dollar index measures the Greenback against a trade-weighted basket of six major currencies, which either ascend 0.01% to 106.622.
The Euro US Dollar (EUR/USD) is a widely traded is down 0.01% today. This left the pair trading around $1.05400.
The Japanese yen was will move positive against the U.S. dollar on Monday. Today USD/JPY is trades pair that increase 0.19% to the 154.64 level.
Another commodity-related currency negative against the U.S dollar, AUD/USD loss 0.04% to 0.64590, and NZD/USD decrease 0.17% to 0.58520 level.
EUR/USD Intraday: Trend on the upside
Our pivot point is at 1.05430
Preferable Price Action: Take buy positions above pivot level with targets at 1.05660 & 1.05880 in extension.
Alternative Price Action: Sell pivot looks for a further downside to 1.05220 & 1.05020.
Comment: RSI is above 50 levels and pairs above its 20MA.
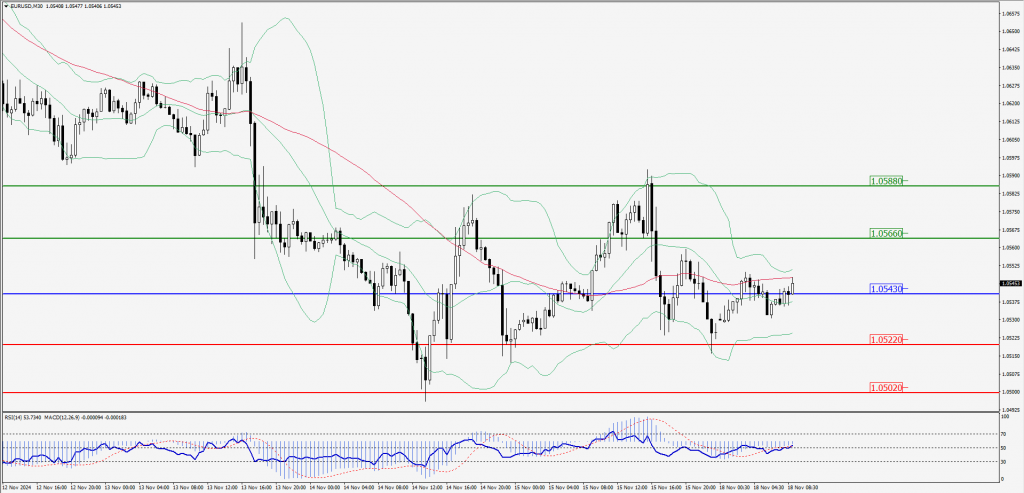
Green Lines Indicate Resistance Levels – Red Lines Indicate Support Levels
Light Blue is a Pivot Point – Black represents the price when the report was produced
GBP/USD Intraday: Trend on the upside
Our pivot point is at 1.26320
Preferable Price Action: Buy positions above pivot with targets at 1.26640 & 1.26930 in extension.
Alternative Price Action: The price below pivot would call for further downside to 1.26000 & 1.25730.
Comment: RSI is above 50 levels and pairs above its 20MA.
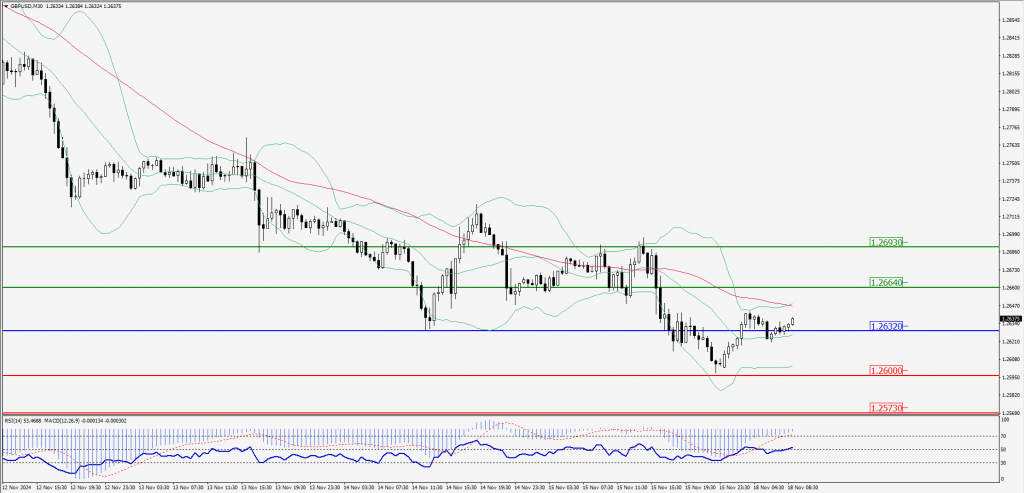
Green Lines Indicate Resistance Levels – Red Lines Indicate Support Levels
Light Blue is a Pivot Point – Black represents the price when the report was produced
USD/JPY Intraday: Trend on the downside
Our pivot point is at 154.580
Preferable Price Action: Sell position below pivot with the target at 154.190 and 153.850 in extension.
Alternative Price Action: The upside breakout of the pivot would call for 154.980 and 155.310.
Comment: MACD is below 50 levels and pairs below its 55MA & 20MA.
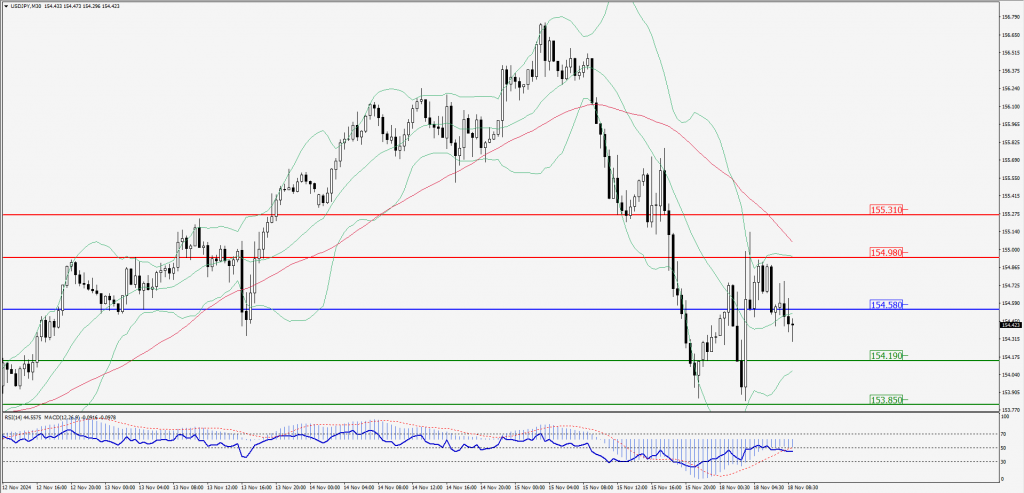
Green Lines Indicate Resistance Levels – Red Lines Indicate Support Levels
Light Blue is a Pivot Point – Black represents the price when the report was produced
AUD/USD Intraday: Resistance level at 0.64690
Our pivot point is at 0.64690
Preferable Price Action: Sell positions below pivot with targets at 0.64540 & 0.64400 in extension.
Alternative Price Action: Above pivot a further upside with 0.64840 & 0.64980 as targets.
Comment: RSI is below 50 levels and pairs below its 20MA.
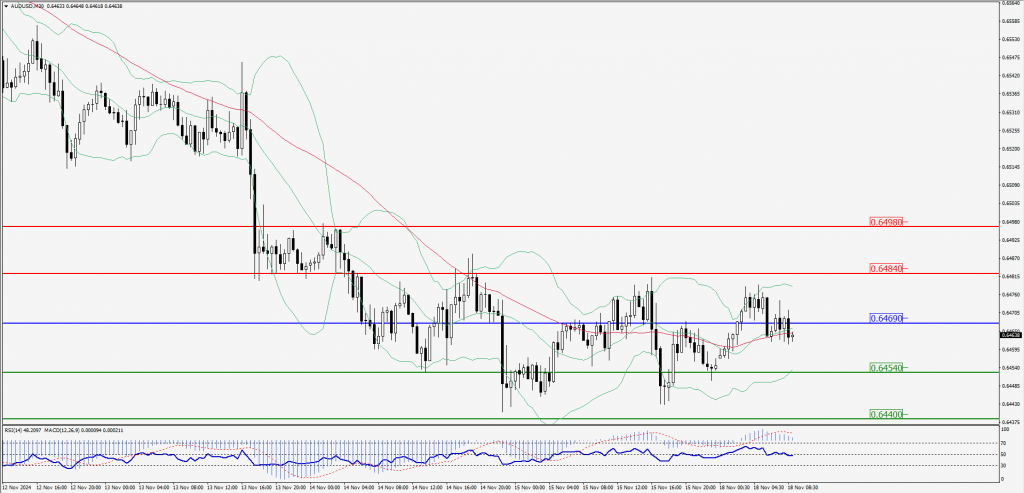
Green Lines Indicate Resistance Levels – Red Lines Indicate Support Levels
Light Blue is a Pivot Point – Black represents the price when the report was produced
CRUDEOIL Intraday: Trend on the downside
Our pivot point is at 67.12
Preferable Price Action: Below pivot sell oil with 66.79 & 66.46 as targets.
Alternative Price Action: Buy crude above pivot with targets at 67.46 & 67.76 in extension.
Comment: RSI is at below 50 levels and pairs below its 20MA & 55MA.
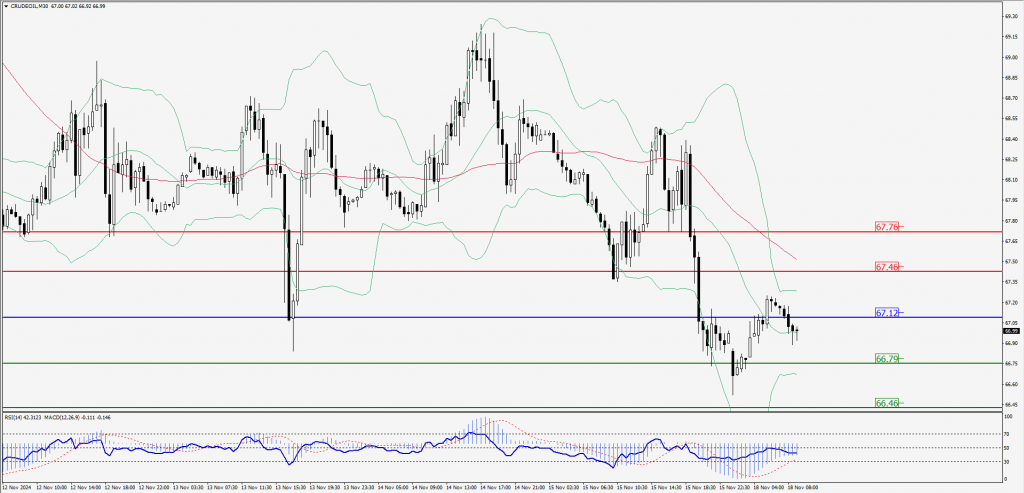
Green Lines Indicate Resistance Levels – Red Lines Indicate Support Levels
Light Blue is a Pivot Point – Black represents the price when the report was produced
XAU/USD Intraday: Trend on the upside
Our pivot point is at 2582.80
Preferable Price Action: Further upside to 2594.90 and 2605.40.
Alternative Price Action: If the price gives an downside breakout of a pivot, then the price extends to 2570.80 and 2560.30.
Comment: MACD is above 50 levels and pairs above its 20MA & 55MA.
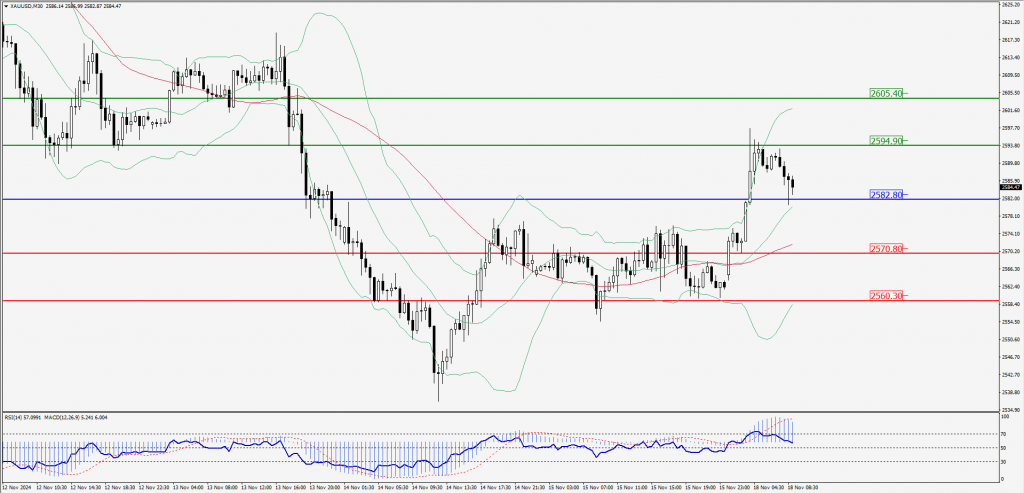
Green Lines Indicate Resistance Levels – Red Lines Indicate Support Levels
Light Blue is a Pivot Point – Black represents the price when the report was produced
Dow Jones Intraday: Trend on the upside
Our pivot point is 43,436.80
Preferable Price Action: Take buy positions above the pivot with targets at 43,586.50 & 43,718.40.
Alternative Price Action: Below 43,436.80 looks for further downside to 43,299.00 & 43,165.10.
Comment: RSI is above 50 levels and pairs above its 20MA.
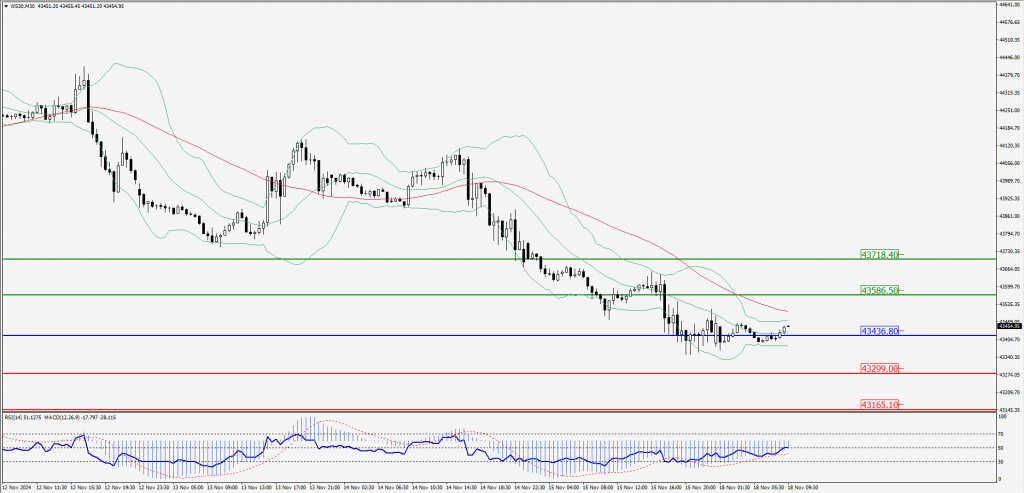
Green Lines Indicate Resistance Levels – Red Lines Indicate Support Levels
Light Blue is a Pivot Point – Black represents the price when the report was produced