Market Wrap: Stocks, Bonds, Commodities
Most Asian currencies weakened on Thursday, while the dollar rose to a one-year high on data showing continued stickiness in U.S. inflation, with focus now turning to an upcoming address by Federal Reserve Chair Jerome Powell.
The Dow Jones Industrial Average rose 47.11 points to 43,958.19, the S&P 500 gain 0.02% to 5,985.38 and the Nasdaq Composite down 50.68 points to 19,230.72.
MSCI’s index of Asia-Pacific stocks outside Japan is down 1.66% to 705.78 levels. The Australian index was higher by 0.37% to 8,224.00. Japanese Nikkei Index decrease 0.61% today.
European stocks were mixed on Thursday, with the Stoxx Europe 50 Index increase 0.72% to 4,774.35 Germany’s DAX ascend 0.68% to 19.105.65, and France’s CAC higher 0.29% to 7,237.83 and U.K.’s FTSE 100 loss 0.16% to 8,017.25.
Benchmark 10-year U.S. Treasury rose as demand for safe assets slipped again, today 10-year bond yields 0.40% to 4.4710.
Oil prices slipped in early trade on Thursday, reversing most of the previous session’s gains on a stronger dollar and worries of higher global output amid slow demand growth forecasts.
Spot Brent crude oil decrease 0.04% to $72.25 per barrel. US West Texas Intermediate crude is decrease 0.09% to $68.37 a barrel.
The yellow metal gold is down 0.98% to 2,561.10 dollars per ounce.
Market Wrap: Forex
The U.S. dollar stood at a one-year high against major peers on Thursday and headed for a fifth straight daily gain fuelled by higher yields and Donald Trump’s election victory.
Today, the U.S. dollar index measures the Greenback against a trade-weighted basket of six major currencies, which either ascend 0.16% to 106.552.
The Euro US Dollar (EUR/USD) is a widely traded is down 0.13% today. This left the pair trading around $1.05490.
The Japanese yen was will move positive against the U.S. dollar on Thursday. Today USD/JPY is trades pair that increase 0.24% to the 155.82 level.
Another commodity-related currency negative against the U.S dollar, AUD/USD loss 0.13% to 0.64770, and NZD/USD decrease 0.18% to 0.58680 level.
EUR/USD Intraday: Trend on the downside
Our pivot point is at 1.05630
Preferable Price Action: Take sell positions below pivot level with targets at 1.05160 & 1.04760 in extension.
Alternative Price Action: Buy pivot looks for a further upside to 1.06100 & 1.06530.
Comment: RSI is below 50 levels and pairs below its 55MA & 20MA.
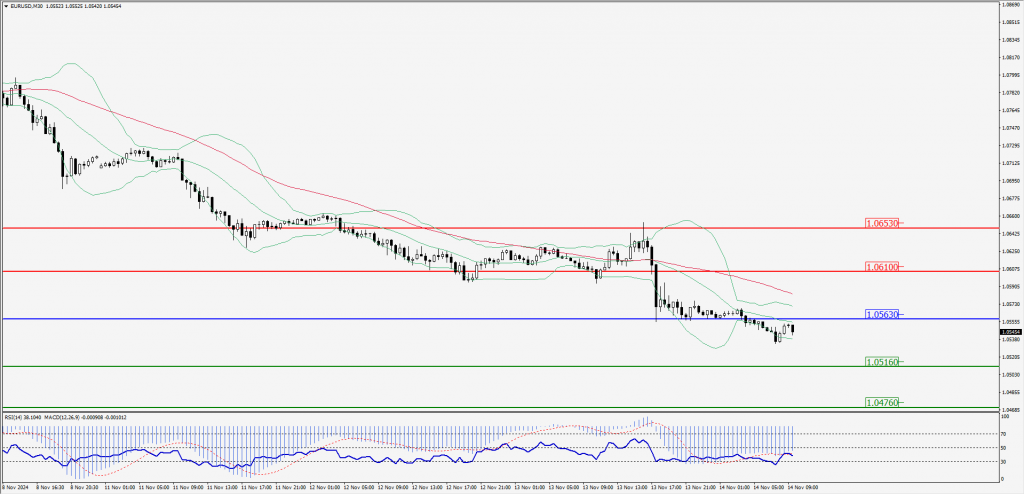
Green Lines Indicate Resistance Levels – Red Lines Indicate Support Levels
Light Blue is a Pivot Point – Black represents the price when the report was produced
GBP/USD Intraday: Trend on the downside
Our pivot point is at 1.27100
Preferable Price Action: Sell positions below pivot with targets at 1.26640 & 1.26240 in extension.
Alternative Price Action: The price above pivot would call for further upside to 1.27560 & 1.27990.
Comment: RSI is below 50 levels and pairs below its 55MA.
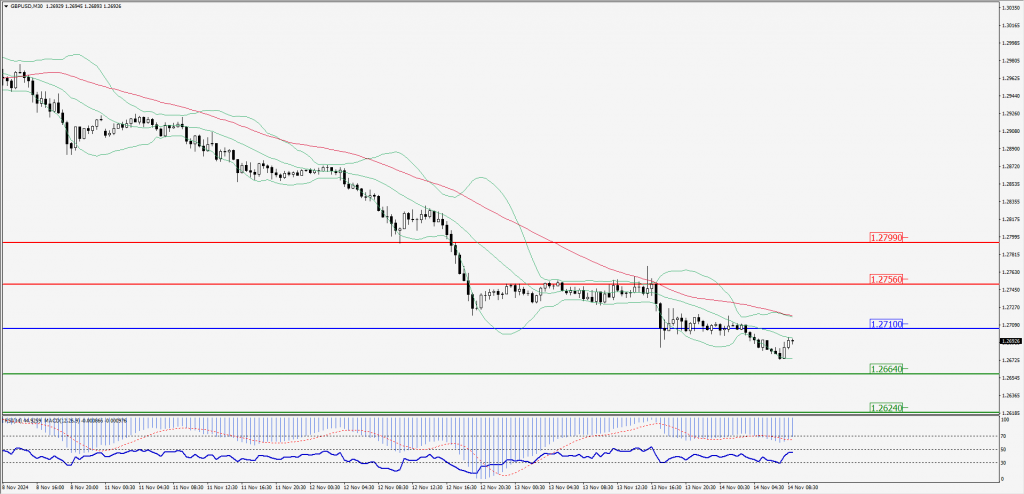
Green Lines Indicate Resistance Levels – Red Lines Indicate Support Levels
Light Blue is a Pivot Point – Black represents the price when the report was produced
USD/JPY Intraday: Trend on the upside
Our pivot point is at 155.760
Preferable Price Action: Buy position above pivot with the target at 156.310 and 156.770 in extension.
Alternative Price Action: The downside breakout of the pivot would call for 155.210 and 154.730.
Comment: MACD is above 50 levels and pairs above its 55MA & 20MA.
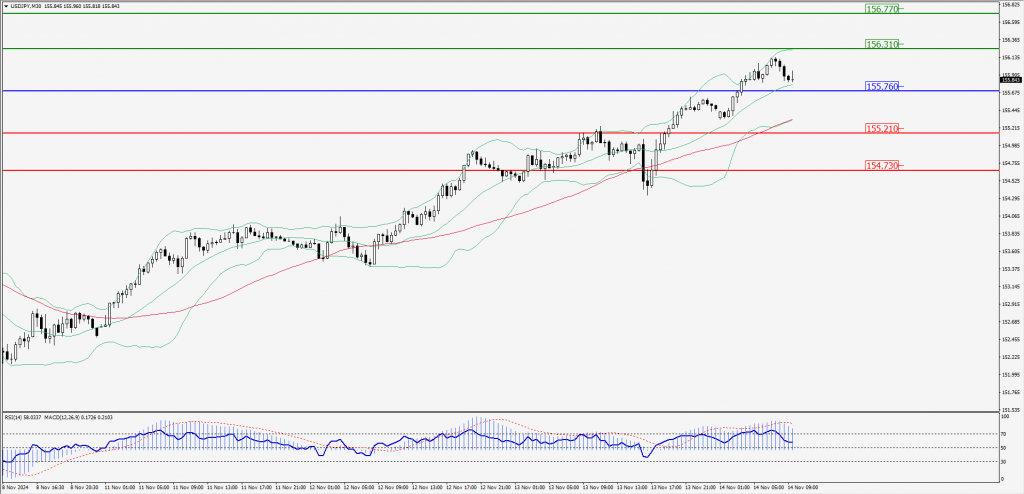
Green Lines Indicate Resistance Levels – Red Lines Indicate Support Levels
Light Blue is a Pivot Point – Black represents the price when the report was produced
AUD/USD Intraday: Trend on the downside
Our pivot point is at 0.64740
Preferable Price Action: Sell positions below pivot with targets at 0.64450 & 0.64200 in extension.
Alternative Price Action: Above pivot a further upside with 0.65050 & 0.65310 as targets.
Comment: RSI is below 50 levels and pairs below its 55MA & 20MA.
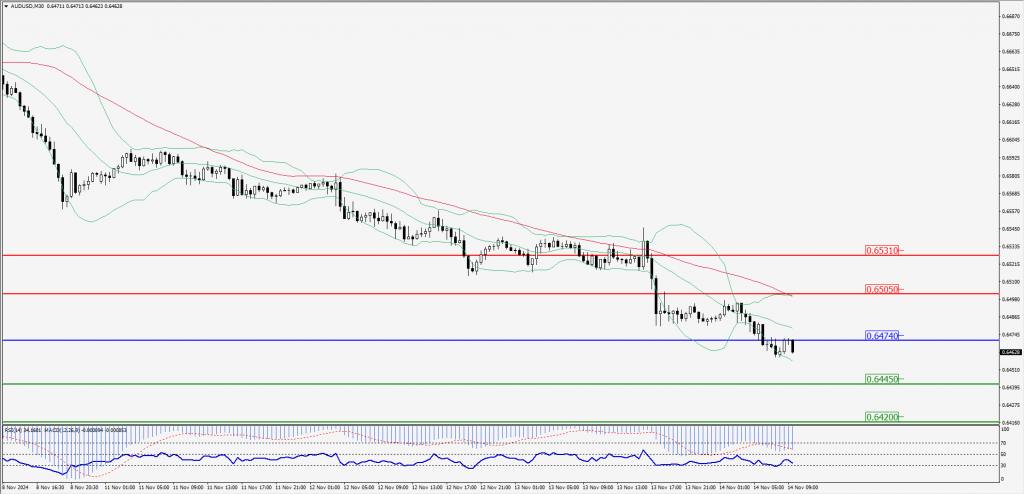
Green Lines Indicate Resistance Levels – Red Lines Indicate Support Levels
Light Blue is a Pivot Point – Black represents the price when the report was produced
CRUDEOIL Intraday: Trend on the downside
Our pivot point is at 68.04
Preferable Price Action: Below pivot sell oil with 67.37 & 66.81 as targets.
Alternative Price Action: Buy crude above pivot with targets at 68.71 & 69.28 in extension.
Comment: RSI is at below 50 levels and pairs below its 20MA & 55MA.
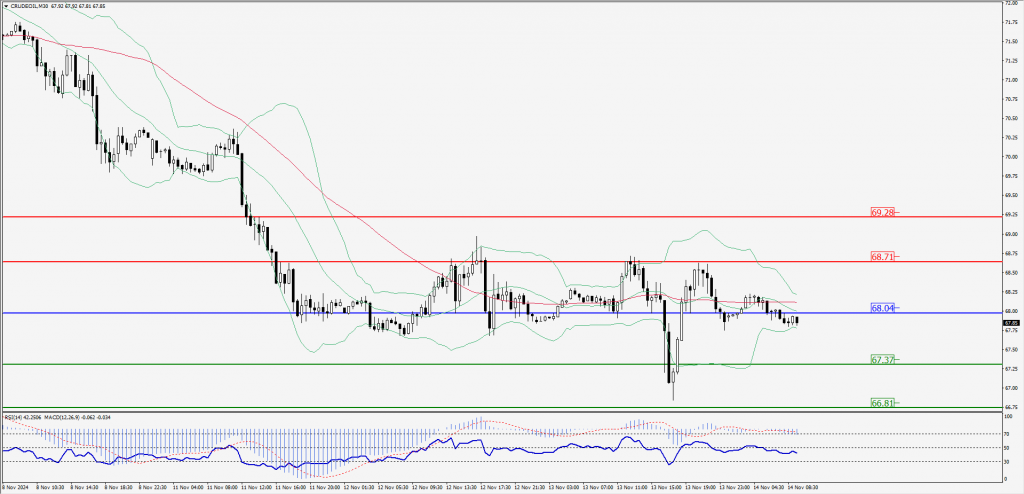
Green Lines Indicate Resistance Levels – Red Lines Indicate Support Levels
Light Blue is a Pivot Point – Black represents the price when the report was produced
XAU/USD Intraday: Major trend on the downside
Our pivot point is at 2563.20
Preferable Price Action: Further downside to 2535.60 and 2513.10.
Alternative Price Action: If the price gives an upside breakout of a pivot, then the price extends to 2590.50 and 2513.40.
Comment: MACD is below 50 levels and pairs below its 20MA & 55MA.
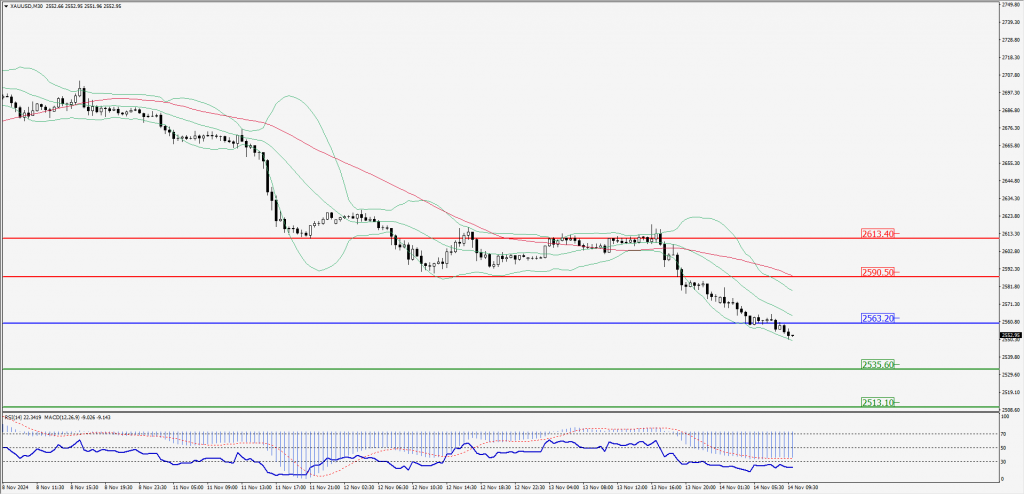
Green Lines Indicate Resistance Levels – Red Lines Indicate Support Levels
Light Blue is a Pivot Point – Black represents the price when the report was produced
Dow Jones Intraday: Trend on the downside
Our pivot point is 43,929.90
Preferable Price Action: Take sell positions below the pivot with targets at 43,821.10 & 43,731.20.
Alternative Price Action: Above 43,929.90 looks for further upside to 43,037.60 & 44,135.20.
Comment: RSI is below 50 levels and pairs below its 20MA & 55MA.
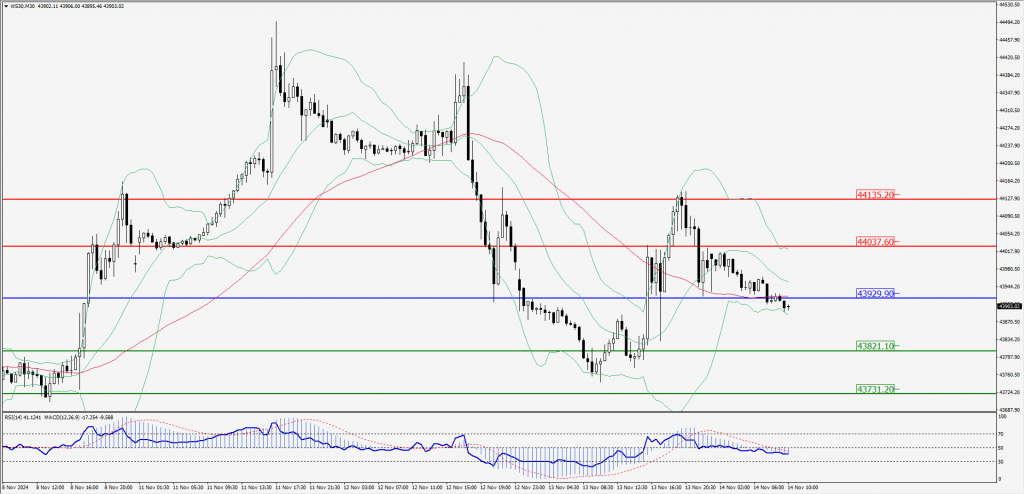
Green Lines Indicate Resistance Levels – Red Lines Indicate Support Levels
Light Blue is a Pivot Point – Black represents the price when the report was produced