Market Wrap: Stocks, Bonds, Commodities
Wall Street ended lower on Monday, with shares of Carnival Corp and several airlines tumbling as investors worried about the Omicron coronavirus variant ahead of a Federal Reserve meeting later this week.
The Dow Jones Industrial Average fell 313.98 points (0.87%) to 35,657.01, the S&P 500 lost 43.56 points (0.92%) to end at 4,668.46 points, while the Nasdaq Composite lost 220.88 points (1.41%) to 15,409.72.
MSCI’s index of Asia-Pacific stocks outside Japan slipped 0.85% to 785.92 levels. Australian index flat to 7,378.40. Japanese Nikkei Index decline 0.73% to 28,432.64.
European stocks were higher on Tuesday, with the Stoxx Europe 50 Index rising 0.62% to 4,208.85, Germany’s DAX gaining 0.69% to 15,688.11, and France’s CAC advances 0.66% to 6,989.02, and U.K.’s FTSE 100 fell 0.70% to 7,280.34.
Benchmark 10-year U.S. Treasury rose as demand for safe assets grows again, today 10-year bond yields flat to 1.511.
Oil futures eased on Monday on worries that rising coronavirus cases around the world could reduce crude demand as new doubts emerged about the effectiveness of vaccines against the Omicron variant.
Spot Brent crude oil rose 0.84% to $75.77 per barrel. US West Texas Intermediate crude gained 1.12% to $72.44 a barrel.
The yellow metal gold is lost 0.05% to 1787.80 dollars per ounce.
Market Wrap: Forex
The dollar traded near a one-week high versus a basket of major rivals on Tuesday, supported by expectations of a hawkish Federal Reserve meeting this week and haven demand amid continued uncertainty about the Omicron coronavirus variant.
Today, the U.S. dollar index measures the greenback against a trade-weighted basket of six major currencies, which rose 0.11% to 96.382.
The Euro US Dollar (EUR/USD) is a widely traded pair that is falling 0.07% today. This left the pairing trading around $1.12740.
The Japanese yen fell against the U.S. dollar on Tuesday as the stock pushes higher. Today US/JPY is rose 0.05% to 113.600 level.
Another commodity-related currency lower against the U.S dollar, AUD/USD lost 0.16% to 0.71150, and NZD/USD declined 0.05% to 0.67470 level.
EUR/USD Intraday: Resistance at 1.13030
Our pivot point is at 1.13030
Preferable Price Action: Take Short positions Below pivot level with targets at 1.12600 & 1.12430 in extension.
Alternative Price Action: Above pivot looks for a further Upside to 1.13390 & 1.13560.
Comment: Pair below its 55MA and RSI below 50 levels.
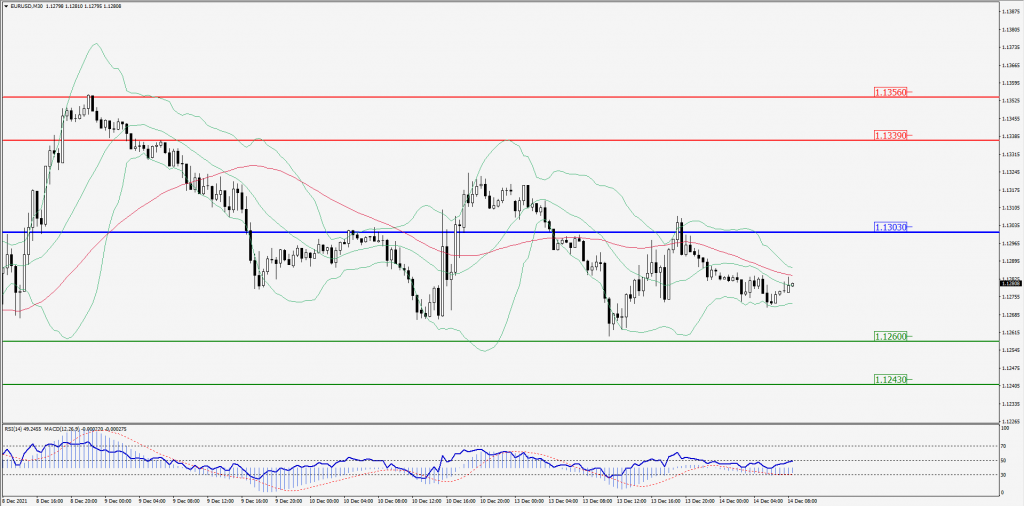
Green Lines Indicate Resistance Levels – Red Lines Indicates Support Levels
Light Blue is a Pivot Point – Black represents the price when the report was produced
GBP/USD Intraday: Resistance at 1.32360
Our pivot point is at 1.32360
Preferable Price Action: Sell positions below pivot with targets at 1.31830 & 1.31590 in extension.
Alternative Price Action: The price above pivot would call for further upside to 1.32930 & 1.33230.
Comment: Pair below its 55MA and RSI at 50 levels.
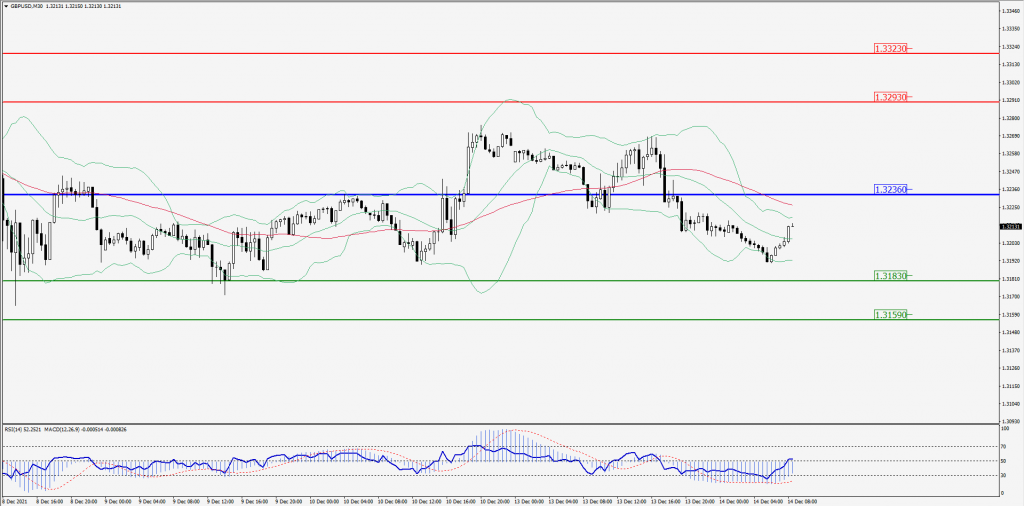
Green Lines Indicate Resistance Levels – Red Lines Indicates Support Levels
Light Blue is a Pivot Point – Black represents the price when the report was produced
USD/JPY Intraday: In a consolidation area
Our pivot point is at 113.390
Preferable Price Action: Buy position Above pivot with the target at 113.800 and 114.030 in extension.
Alternative Price Action: The Downside breakout of the pivot would call for 112.990 and 112.860.
Comment: Price above its 20MA and MACD in positive territory.
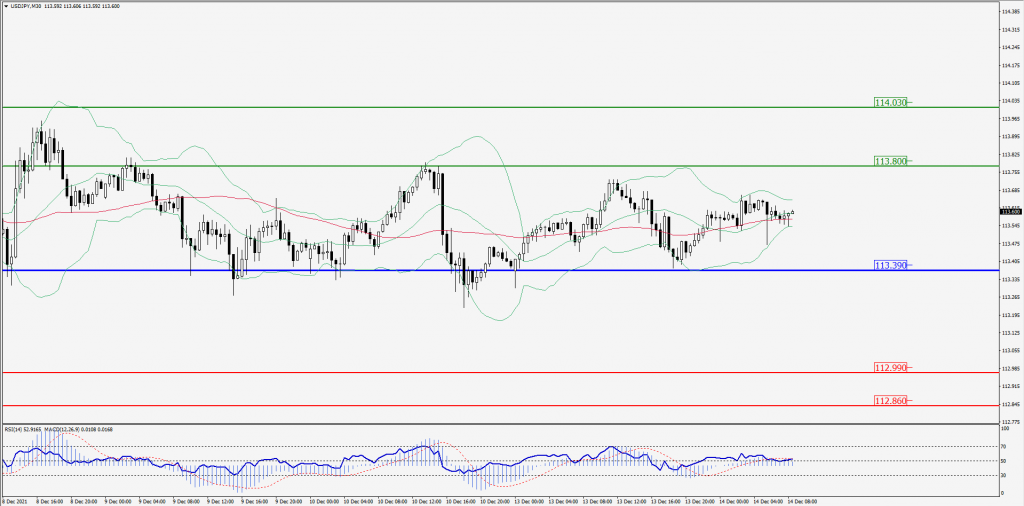
Green Lines Indicate Resistance Levels – Red Lines Indicates Support Levels
Light Blue is a Pivot Point – Black represents the price when the report was produced
AUD/USD Intraday: Trend on the downside
Our pivot point is at 0.71290
Preferable Price Action: Sell Positions below pivot with targets at 0.70930 & 0.70730 in extension.
Alternative Price Action: Above pivot looks for a further upside with 0.71690 & 0.71900 as targets.
Comment: Pair below its 55MA & 20MA and RSI below 50 levels.
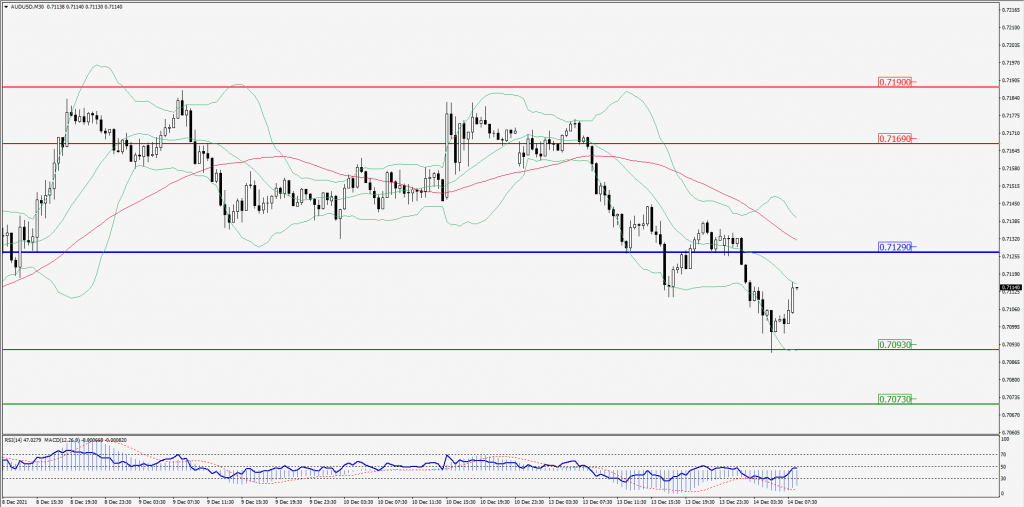
Green Lines Indicate Resistance Levels – Red Lines Indicates Support Levels
Light Blue is a Pivot Point – Black represents the price when the report was produced
CRUDEOIL Intraday: In a consolidation area
Our pivot point is at 70.30
Preferable Price Action: Above pivots Buy Oil with 72.00 & 72.90 as targets.
Alternative Price Action: Sell crude Below pivot with targets at 68.90 and 68.10 in extension.
Comment: Crude is above its 20MA and MACD in the positive territory.
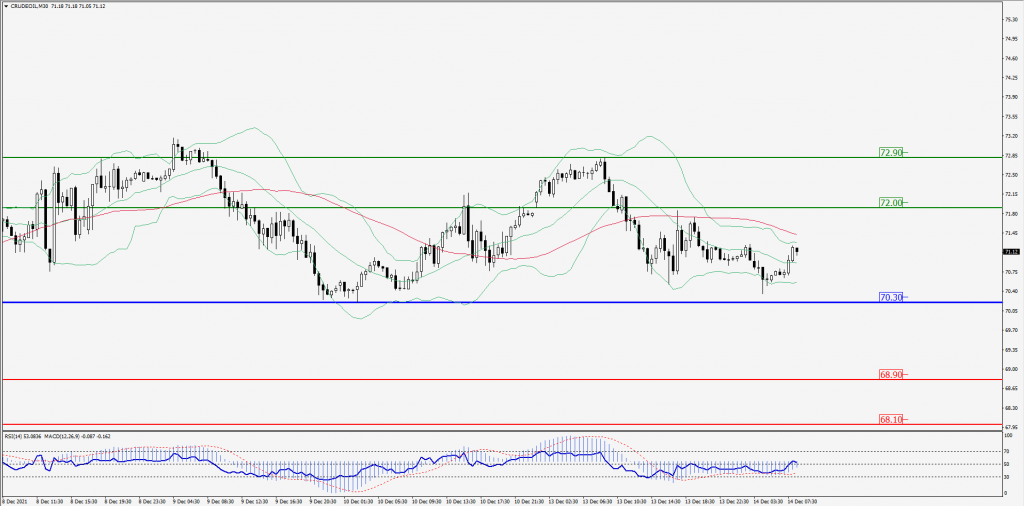
Green Lines Indicate Resistance Levels – Red Lines Indicates Support Levels
Light Blue is a Pivot Point – Black represents the price when the report was produced
XAU/USD Intraday: Support at 1784.30
Our pivot point is 1784.30
Preferable Price Action: Further upside to 1792.90 and 1797.30.
Alternative Price Action: If the price gives an upside breakout of a pivot, then the price extends to 1774.60 and 1770.60.
Comment: MACD in positive territory and price above its 20MA & 55MA.
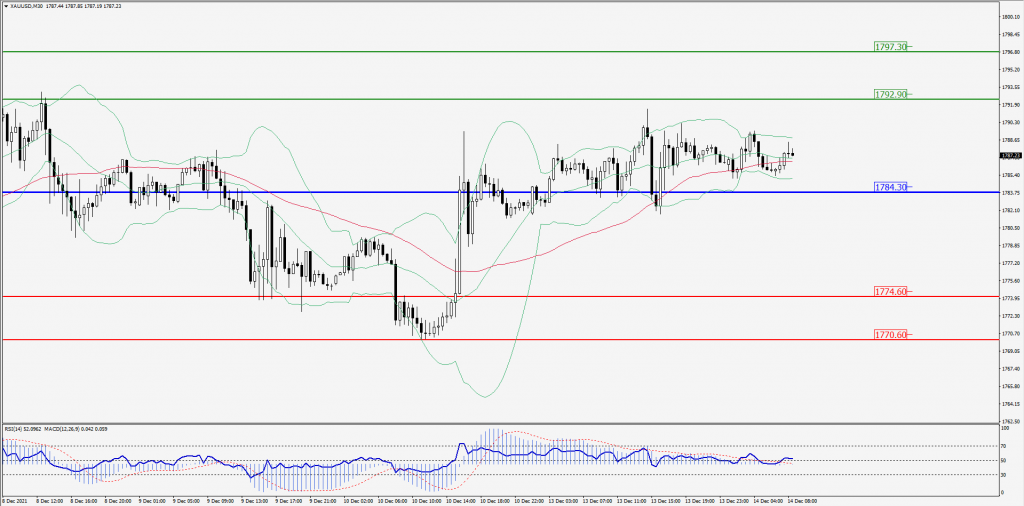
Green Lines Indicate Resistance Levels – Red Lines Indicates Support Levels
Light Blue is a Pivot Point – Black represents the price when the report was produced
Dow Jones Intraday: Resistance 35,830.00
Our pivot point is 35,830.00
Preferable Price Action: Take Short positions below pivot with targets at 35,530.00 & 35,360.00.
Alternative Price Action: Below 35,830.00 looks for further Upside to 36,130.00 & 36,260.00.
Comment: Price below its 55MA & 20MA and RSI below 50 levels.
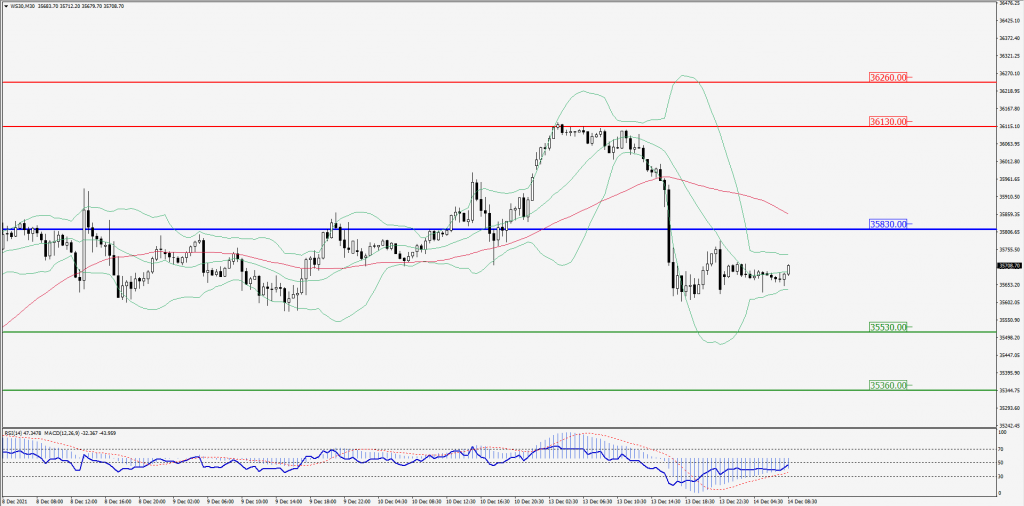
Green Lines Indicate Resistance Levels – Red Lines Indicates Support Levels
Light Blue is a Pivot Point – Black represents the price when the report was produced