Market Wrap: Stocks, Bonds, Commodities
The S&P 500 closed higher on Monday, ending a five-day losing streak as traders focused on potential corporate tax hikes and upcoming economic data.
The Dow Jones Industrial Average rose 261.91 points (0.76%) to 34,869.63, the S&P 500 gained 10.15 points (0.23%) at 4,468.73 and the Nasdaq Composite dropped 9.91 points (0.07%) to 15,105.58.
Asia’s share markets were mixed and the dollar held steady on Tuesday, with investors awaiting U.S inflation data for more clues on when the Federal Reserve will taper stimulus.
MSCI’s index of Asia-Pacific stocks outside Japan plunged 0.34% to 831.55 levels. Australian index rose 0.16% to 7,437.30. Japanese Nikkei gained 0.73% to 30,670.10.
European stocks were lower on Tuesday, with the Stoxx Europe 50 Index down 0.30% to 4,177.05, Germany’s DAX fell 0.05% to 15,696.05, and France’s CAC lost 0.54% to 6,640.86, and U.K.’s FTSE 100 slipped 0.35% to 7,043.48.
Benchmark 10-year U.S. Treasury rose as demand for safe assets grows again, today 10-year bond yields rose 0.27% to 1.328.
Oil prices extended gains on Tuesday, hovering near a six-week high, on signs another storm could affect output in Texas this week even as the US industry struggles to return production after Hurricane Ida wreaked havoc on the Gulf Coast.
Spot Brent crude oil advance 0.76% to $74.05 per barrel. US West Texas Intermediate crude gained 0.82% to $71.03 a barrel.
Gold prices were subdued on Monday as the dollar held firm, while cautious investors awaited readings on U.S. consumer prices due this week that could be crucial to Federal Reserve’s decision on when to exit its super-supportive policy.
The yellow metal traded lower 0.05% to 1793.55 dollars per ounce.
Market Wrap: Forex
The dollar was little changed against other major currencies on Tuesday as investors looked to U.S. inflation data later in the session for clues on the timing of policy tightening by the Federal Reserve.
Today, the U.S. dollar index measures the greenback against a trade-weighted basket of six major currencies, which slipped 0.06% to 92.597.
The Euro US Dollar (EUR/USD) is a widely traded pair that gained 0.05% today. This left the pairing trading around $1.18120.
The Japanese yen lost against the U.S. dollar on Tuesday as the stock pushes higher. Today US/JPY rose 0.07% to 110.050 level.
Another commodity-related currency lower against the U.S dollar, AUD/USD down 0.41% to 0.73350, and NZD/USD decline 0.18% to 0.71070 level.
EUR/USD Intraday: Trend may reverse to upside
Our pivot point is at 1.17990
Preferable Price Action: Take long positions above pivot level with targets at 1.18370 & 1.18580 in extension.
Alternative Price Action: Below pivot looks for a further downside to 1.17620 & 1.17410.
Comment: Pair above its 20MA & 50MA and RSI above 50 levels.
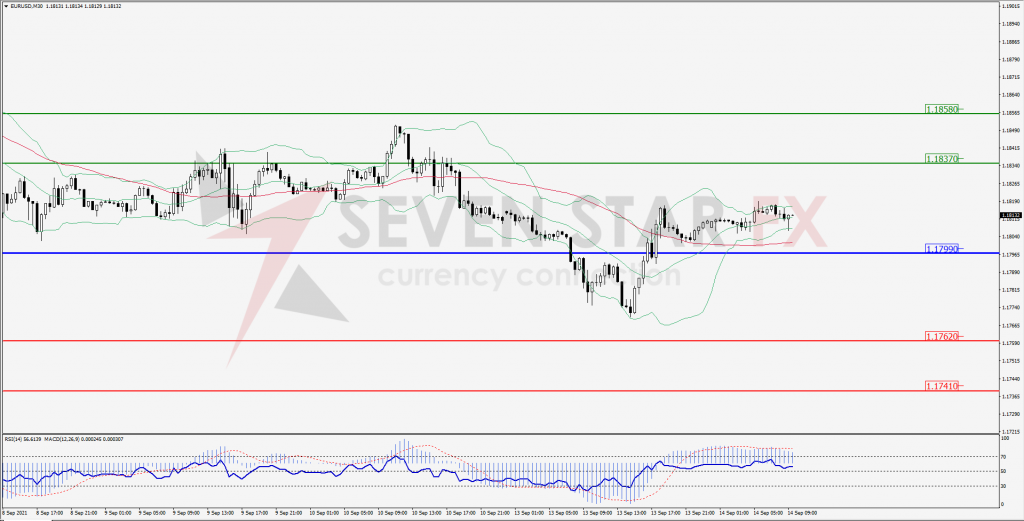
Green Lines Indicate Resistance Levels – Red Lines Indicates Support Levels
Light Blue is a Pivot Point – Black represents the price when the report was produced
GBP/USD Intraday: Support at 1.38220
Our pivot point is at 1.38220
Preferable Price Action: Buy positions above pivot with targets at 1.38750 & 1.39000 in extension.
Alternative Price Action: The price below pivot would call for further downside to 1.37700 & 1.37440.
Comment: Pair above its 55MA & 20MA and RSI above 50 levels.
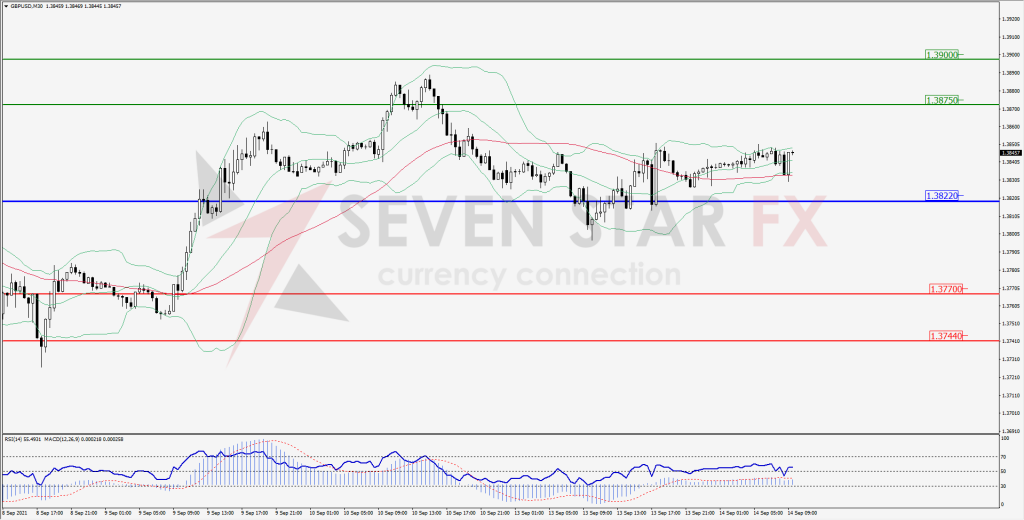
Green Lines Indicate Resistance Levels – Red Lines Indicates Support Levels
Light Blue is a Pivot Point – Black represents the price when the report was produced
USD/JPY Intraday: Support at 109.945
Our pivot point is at 109.960
Preferable Price Action: Buy position above pivot with the target at 110.240 and 110.380 in extension.
Alternative Price Action: The downside breakout of the pivot would call for 109.680 and 109.540.
Comment: Price above its 55MA and MACD in positive territory.
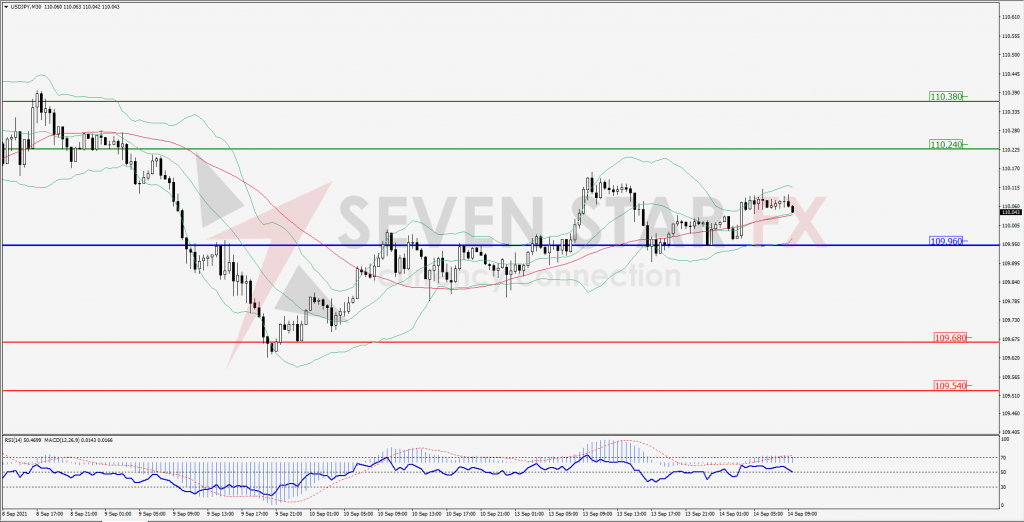
Green Lines Indicate Resistance Levels – Red Lines Indicates Support Levels
Light Blue is a Pivot Point – Black represents the price when the report was produced
AUD/USD Intraday: Break support level
Our pivot point is at 0.73630
Preferable Price Action: Sell Positions below pivot with targets at 0.73170 & 0.72970 in extension.
Alternative Price Action: Above pivot looks for a further upside with 0.74070 & 0.74270 as targets.
Comment: Pair below its 55MA & 20MA and RSI at oversold levels.
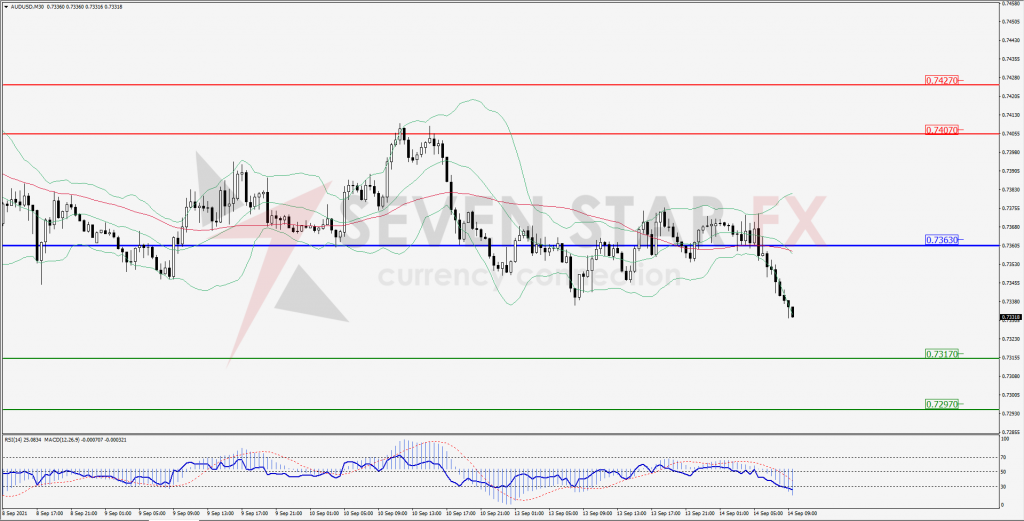
Green Lines Indicate Resistance Levels – Red Lines Indicates Support Levels
Light Blue is a Pivot Point – Black represents the price when the report was produced
CRUDEOIL Intraday: Trend on the upside
Our pivot point is at 70.17
Preferable Price Action: Above pivots buy Oil with 71.65 & 72.36 as targets.
Alternative Price Action: Sell crude below pivot with targets at 68.78 and 68.02 in extension.
Comment: Crude is above its 55MA & 20MA and MACD in the positive territory.
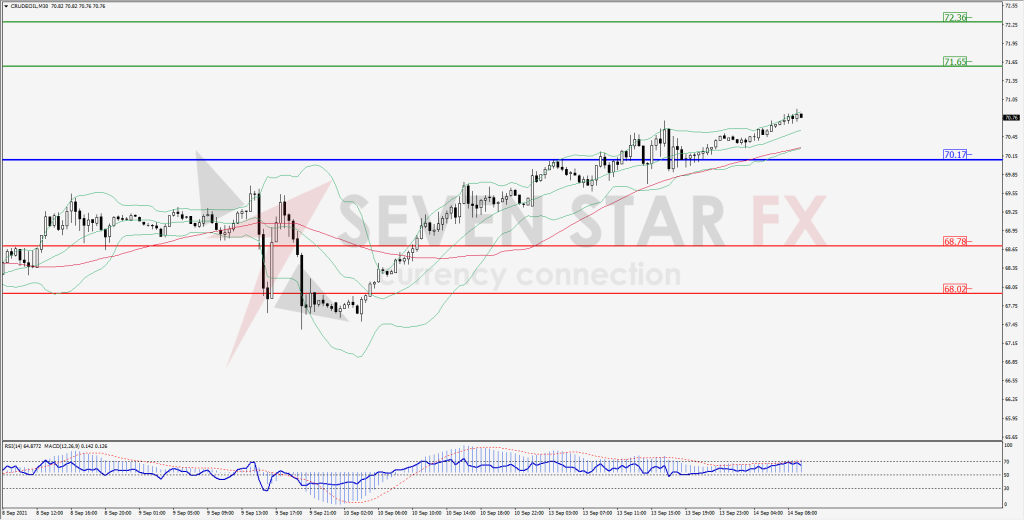
Green Lines Indicate Resistance Levels – Red Lines Indicates Support Levels
Light Blue is a Pivot Point – Black represents the price when the report was produced
XAU/USD Intraday: In a consolidation zone
Our pivot point is 1789.40
Preferable Price Action: Further upside to 1799.40 and 1805.00.
Alternative Price Action: If the price gives a downside breakout of a pivot, then the price extends to 1778.70 and 1773.50.
Comment: MACD in positive territory and price above its 20MA & 55MA.
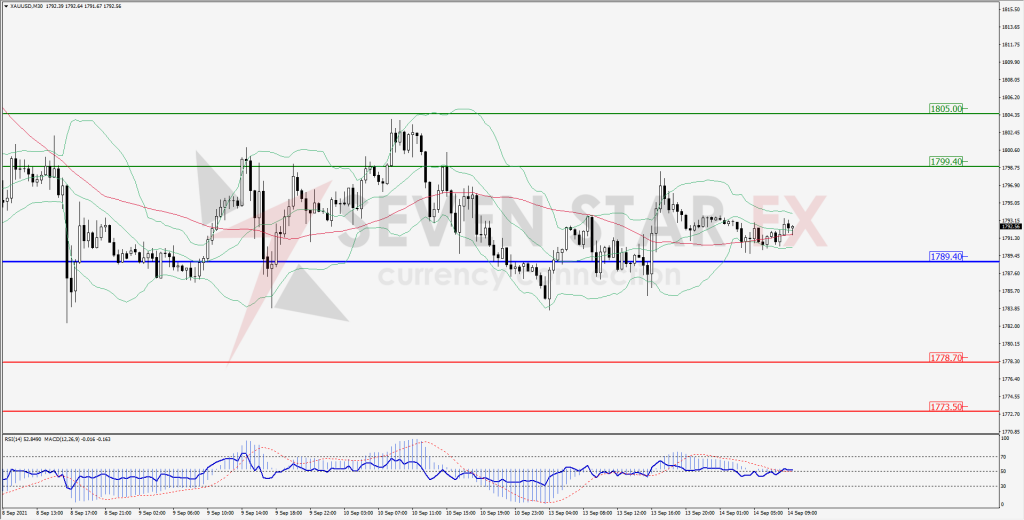
Green Lines Indicate Resistance Levels – Red Lines Indicates Support Levels
Light Blue is a Pivot Point – Black represents the price when the report was produced
Dow Jones Intraday: Support at 34,831.00
Our pivot point is 34,831.00
Preferable Price Action: Take long positions above pivot with targets at 35,082.00 & 35,194.00.
Alternative Price Action: below 34,831.00 looks for further downside to 34,579.00 & 34,467.00.
Comment: Price above it 55MA and RSI at 50 levels.
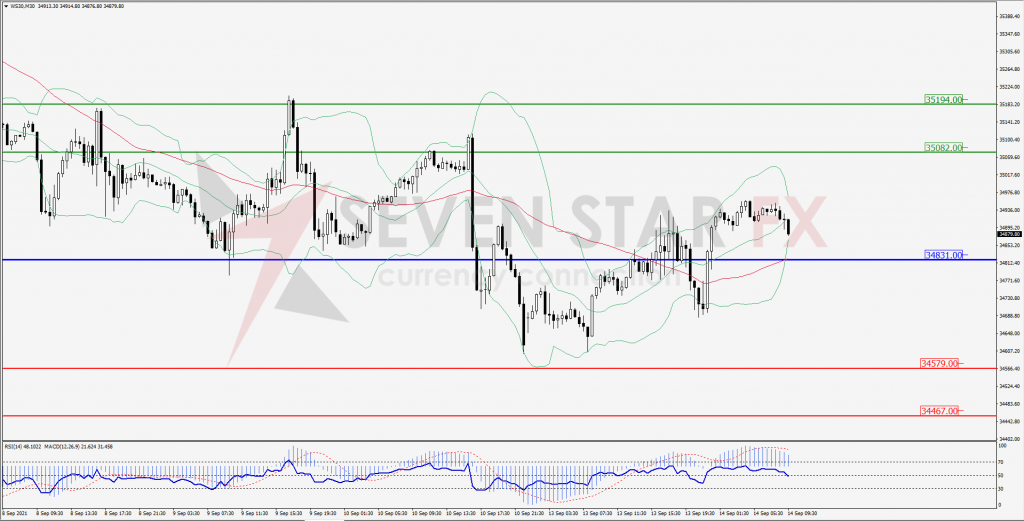
Green Lines Indicate Resistance Levels – Red Lines Indicates Support Levels
Light Blue is a Pivot Point – Black represents the price when the report was produced