Market Wrap: Stocks, Bonds, Commodities
Wall Street lost ground on Tuesday as economic uncertainties and the increasing likelihood of a corporate tax rate hike dampened investor sentiment and prompted a broad sell-off despite signs of easing inflation.
The Dow Jones Industrial Average fell 292.06 points (0.84%) to 34,577.57; the S&P 500 lost 25.68 points (0.57%) at 4,443.05; and the Nasdaq Composite dropped 67.82 points (0.45%) to 15,037.76.
Asian major indices slipped on Wednesday as weaker-than-expected Chinese economic data reinforced worries about slowing global growth, amid fraught nerves over pandemic-related business disruptions and central banks’ plans to taper stimulus.
MSCI’s index of Asia-Pacific stocks outside Japan plunged 0.81% to 823.74 levels. Australian index fell 0.27% to 7,417.00. Japanese Nikkei lost 0.52% to 30,511.71.
European stocks were higher on Wednesday, with the Stoxx Europe 50 Index rose 0.07% to 4,193.45, Germany’s DAX gained 0.05% to 15,730.40, and France’s CAC lost 0.06% to 6,648.24, and U.K.’s FTSE 100 slipped 0.05% to 7,030.50.
Benchmark 10-year U.S. Treasury rose as demand for safe assets grows again, today 10-year bond yields rose 0.36% to 1.284.
Oil prices hit a six-week high on Tuesday as Hurricane Nicholas weakened into a tropical storm, bringing the threat of widespread floods and power outages to Texas and Louisiana, and as the International Energy Agency forecast a big demand rebound for the rest of the year.
Spot Brent crude oil advance 0.95% to $74.30 per barrel. US West Texas Intermediate crude gained 0.97% to $71.14 a barrel.
The yellow metal traded lower 0.30% to 1801.90 dollars per ounce.
Market Wrap: Forex
The dollar drifted within recent ranges against major peers on Wednesday after softer-than-expected U.S. inflation raised doubts about a taper of Federal Reserve stimulus this year.
Today, the U.S. dollar index measures the greenback against a trade-weighted basket of six major currencies, which slipped 0.05% to 92.580.
The Euro US Dollar (EUR/USD) is a widely traded pair that gained 0.06% today. This left the pairing trading around $1.18090.
The Japanese yen lost against the U.S. dollar on Wednesday as the stock pushes higher. Today US/JPY lost 0.11% to 109.520 level.
Another commodity-related currency mixed against the U.S dollar, AUD/USD gained 0.07% to 0.73230, and NZD/USD flat to 0.70950 level.
EUR/USD Intraday: In a consolidation zone
Our pivot point is at 1.18190
Preferable Price Action: Take short positions below pivot level with targets at 1.17880 & 1.17720 in extension.
Alternative Price Action: Above pivot looks for a further upside to 1.18500 & 1.18670.
Comment: Pair below its 55MA and RSI at 50 levels.
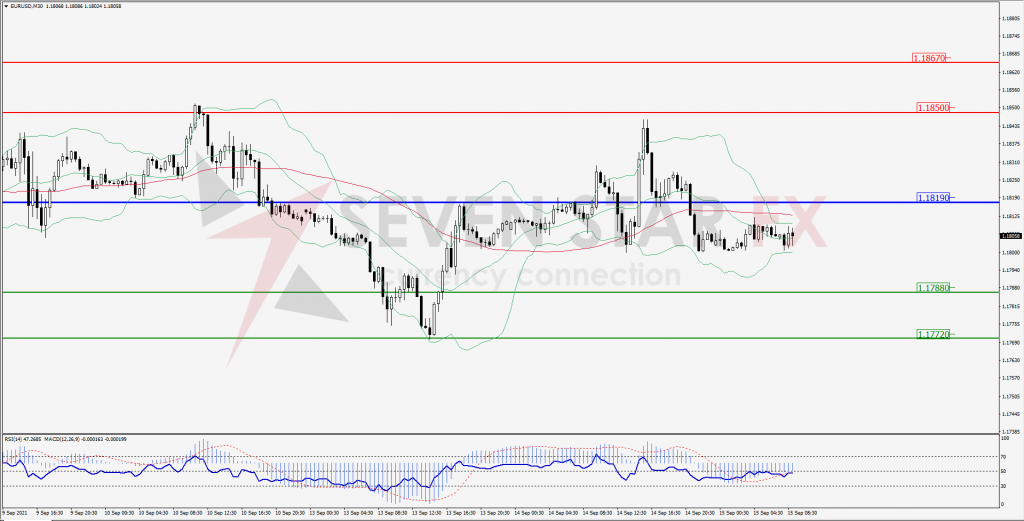
Green Lines Indicate Resistance Levels – Red Lines Indicates Support Levels
Light Blue is a Pivot Point – Black represents the price when the report was produced
GBP/USD Intraday: Resistance at 1.38490
Our pivot point is at 1.38490
Preferable Price Action: Sell positions below pivot with targets at 1.37840 & 1.37510 in extension.
Alternative Price Action: The price above pivot would call for further upside to 1.39110 & 1.39430.
Comment: Pair below its 55MA and RSI above 50 levels.
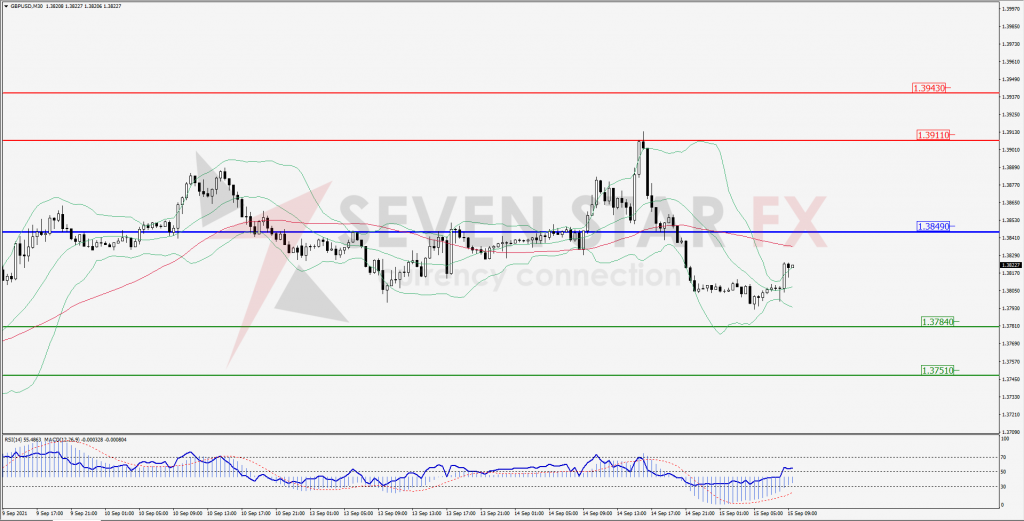
Green Lines Indicate Resistance Levels – Red Lines Indicates Support Levels
Light Blue is a Pivot Point – Black represents the price when the report was produced
USD/JPY Intraday: Trend on the downside
Our pivot point is at 109.710
Preferable Price Action: Sell position below pivot with the target at 109.420 and 109.250 in extension.
Alternative Price Action: The upside breakout of the pivot would call for 110.020 and 110.190.
Comment: Price below its 55MA & 20MA and MACD in negative territory.
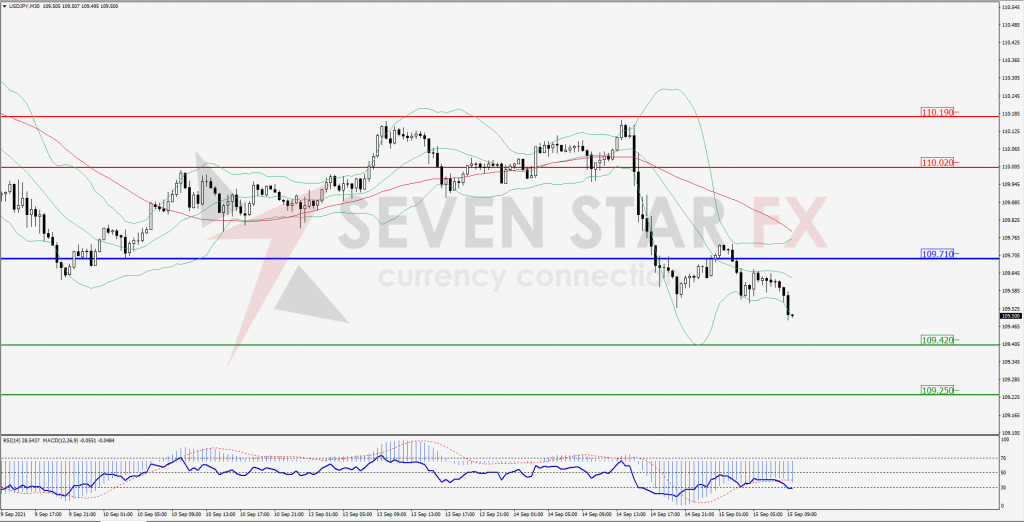
Green Lines Indicate Resistance Levels – Red Lines Indicates Support Levels
Light Blue is a Pivot Point – Black represents the price when the report was produced
AUD/USD Intraday: Break support level
Our pivot point is at 0.73410
Preferable Price Action: Sell Positions below pivot with targets at 0.72990 & 0.72790 in extension.
Alternative Price Action: Above pivot looks for a further upside with 0.73820 & 0.74020 as targets.
Comment: Pair below its 55MA & 20MA and RSI below 50 levels.
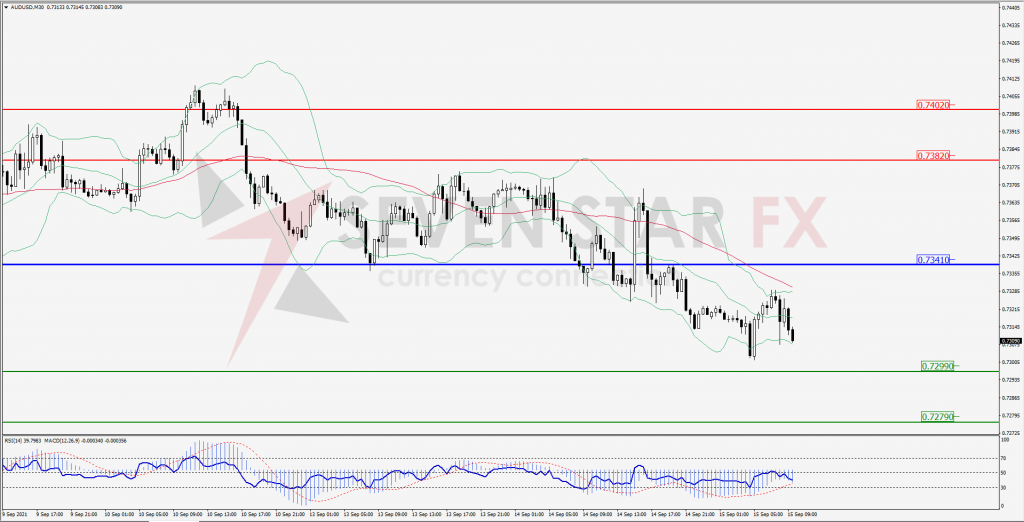
Green Lines Indicate Resistance Levels – Red Lines Indicates Support Levels
Light Blue is a Pivot Point – Black represents the price when the report was produced
CRUDEOIL Intraday: Trend on the upside
Our pivot point is at 70.17
Preferable Price Action: Above pivots buy Oil with 71.66 & 72.37 as targets.
Alternative Price Action: Sell crude below pivot with targets at 68.80 and 68.03 in extension.
Comment: Crude is above its 55MA & 20MA and MACD in the positive territory.
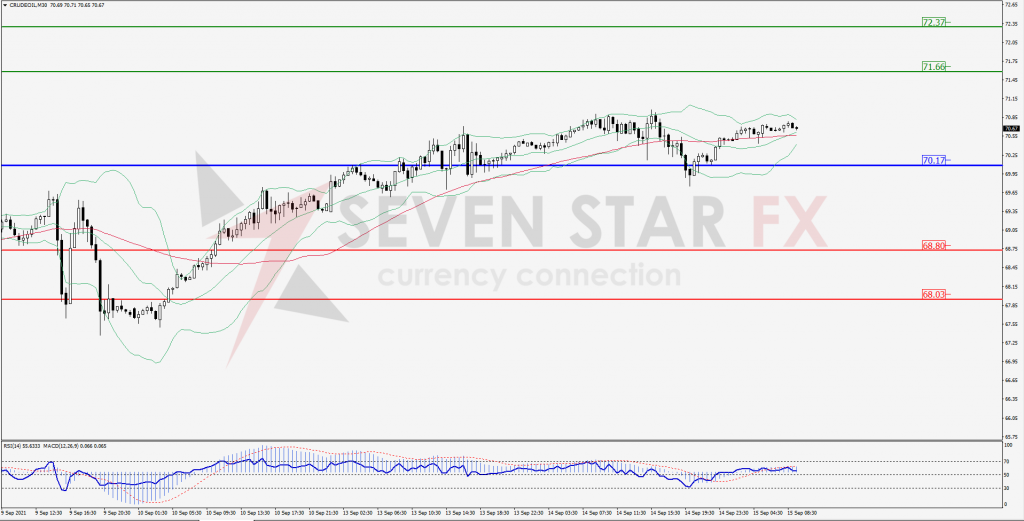
Green Lines Indicate Resistance Levels – Red Lines Indicates Support Levels
Light Blue is a Pivot Point – Black represents the price when the report was produced
XAU/USD Intraday: Break resistance level
Our pivot point is 1795.60
Preferable Price Action: Further upside to 1807.30 and 1812.60.
Alternative Price Action: If the price gives a downside breakout of a pivot, then the price extends to 1785.10 and 1779.80.
Comment: MACD in positive territory and price above its 55MA.
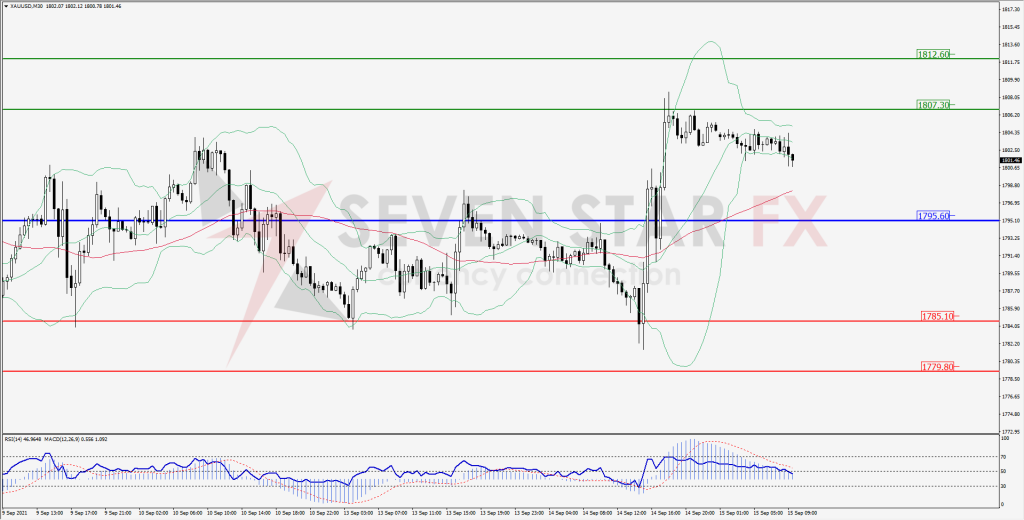
Green Lines Indicate Resistance Levels – Red Lines Indicates Support Levels
Light Blue is a Pivot Point – Black represents the price when the report was produced
Dow Jones Intraday: Trend on downside
Our pivot point is 34,763.00
Preferable Price Action: Take short positions below pivot with targets at 34,492.00 & 34,364.00.
Alternative Price Action: above 34,763.00 looks for further upside to 35,029.00 & 35,165.00.
Comment: Price below it 55MA & 20MA and RSI below 50 levels.
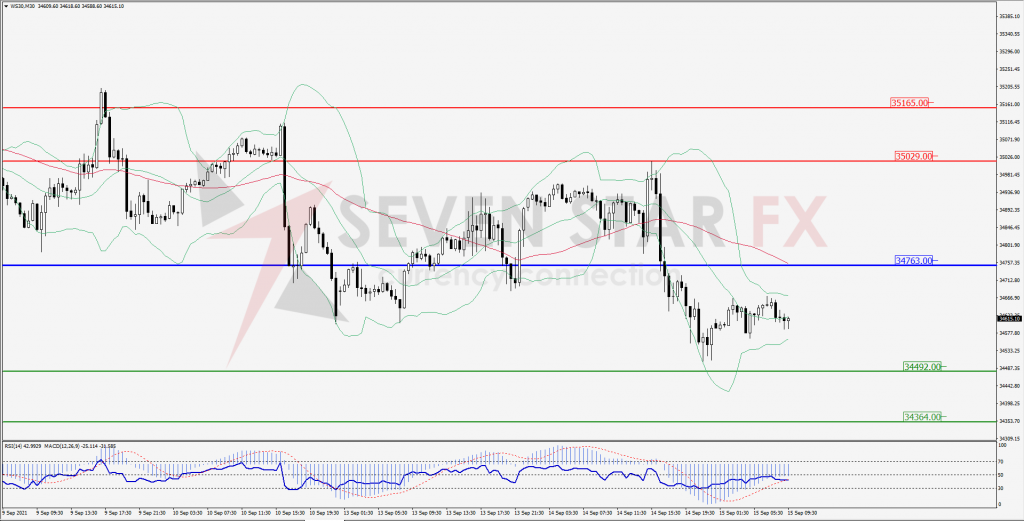
Green Lines Indicate Resistance Levels – Red Lines Indicates Support Levels
Light Blue is a Pivot Point – Black represents the price when the report was produced