Market Wrap: Stocks, Bonds, Commodities
American major stock indices ended lower on Friday as traders weighed signs of higher inflation as row material cost rise, while Apple Inc tumbled following an unfavorable court ruling related to its apple app store.
The Dow Jones Industrial Average index slipped 271.66 points (0.78%) to close at 34,607.72 points, while the S&P 500 deopped 34.70 points (0.77%) to 4,458.58. The Nasdaq Composite fell 132.8 points (0.87%) to 15,115.49.
Asian major index stated lower on Monday to a week packed with important U.S. and Chinese economic data and the launch of Apple’s latest iPhones.
MSCI’s index of Asia-Pacific stocks outside Japan plunged 1.45% to 830.13 levels. Australian index fell 0.10% to 7,400.20. Japanese Nikkei lost 0.17% to 30,331.50.
European stocks were higher on Monday, with the Stoxx Europe 50 Index up 0.55% to 4,193.15, Germany’s DAX gained 0.62% to 15,709.20, and France’s CAC rose 0.55% to 6,700.00, and U.K.’s FTSE 100 higher 0.43% to 7,059.50.
Benchmark 10-year U.S. Treasury rose as demand for safe assets grows again, today 10-year bond yields lost 0.63% to 1.333.
Crude Oil prices climbed on Monday to a one-week high in a second straight session of gains as concerns over US supplies following damage from Hurricane Ida supported the market, along with expectations for higher demand from Asian countries.
Spot Brent crude oil advance 0.40% to $73.21 per barrel. US West Texas Intermediate crude gained 0.44% to $70.03 a barrel.
Gold prices were subdued on Monday as the dollar held firm, while cautious investors awaited readings on U.S. consumer prices due this week that could be crucial to Federal Reserve’s decision on when to exit its super-supportive policy.
The yellow metal traded higher 0.10% to 1791.88 dollars per ounce.
Market Wrap: Forex
The dollar began a week full of big economic data on a firm footing, with investors wary of the Federal Reserve beginning its exit from super-supportive policy even as cases of the coronavirus surge.
Today, the U.S. dollar index measures the greenback against a trade-weighted basket of six major currencies, which rose 0.20% to 92.757.
The Euro US Dollar (EUR/USD) is a widely traded pair that fell 0.18% today. This left the pairing trading around $1.17930.
The Japanese yen lost against the U.S. dollar on Monday as the stock pushes higher. Today US/JPY rose 0.10% to 110.010 level.
Another commodity-related currency lower against the U.S dollar, AUD/USD down 0.14% to 0.73440, and NZD/USD slipped 0.13% to 0.71020 level.
EUR/USD Intraday: Resistance at 1.18061
Our pivot point is at 1.18061
Preferable Price Action: Take short positions below pivot level with targets at 1.17659 & 1.17392 in extension.
Alternative Price Action: Above pivot looks for a further upside to 1.18454 & 1.18726.
Comment: Pair below its 20MA & 20MA and RSI at oversold levels.
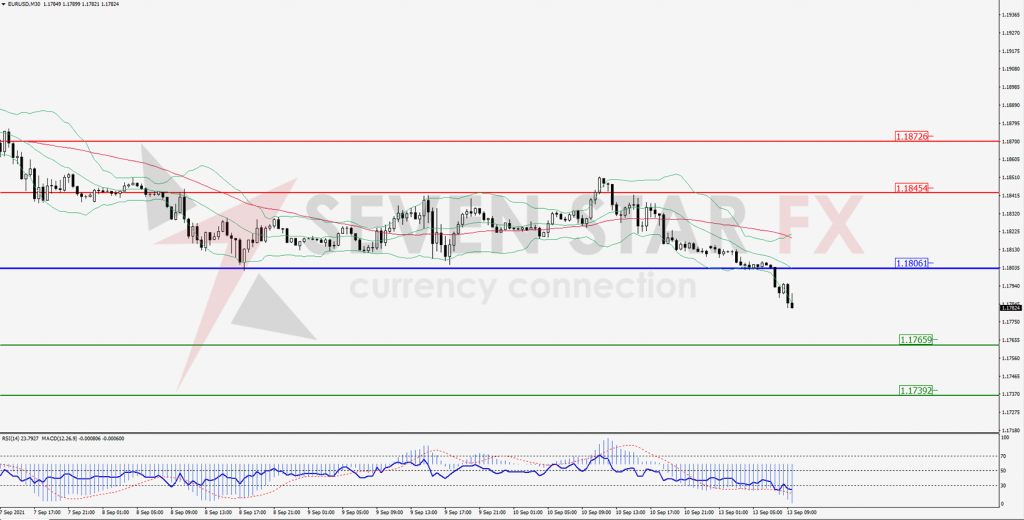
Green Lines Indicate Resistance Levels – Red Lines Indicates Support Levels
Light Blue is a Pivot Point – Black represents the price when the report was produced
GBP/USD Intraday: Break support level
Our pivot point is at 1.38445
Preferable Price Action: Sell positions below pivot with targets at 1.37869 & 1.37564 in extension.
Alternative Price Action: The price above pivot would call for further upside to 1.38932 & 1.39218.
Comment: Pair below its 55MA & 20MA and RSI below 50 levels.
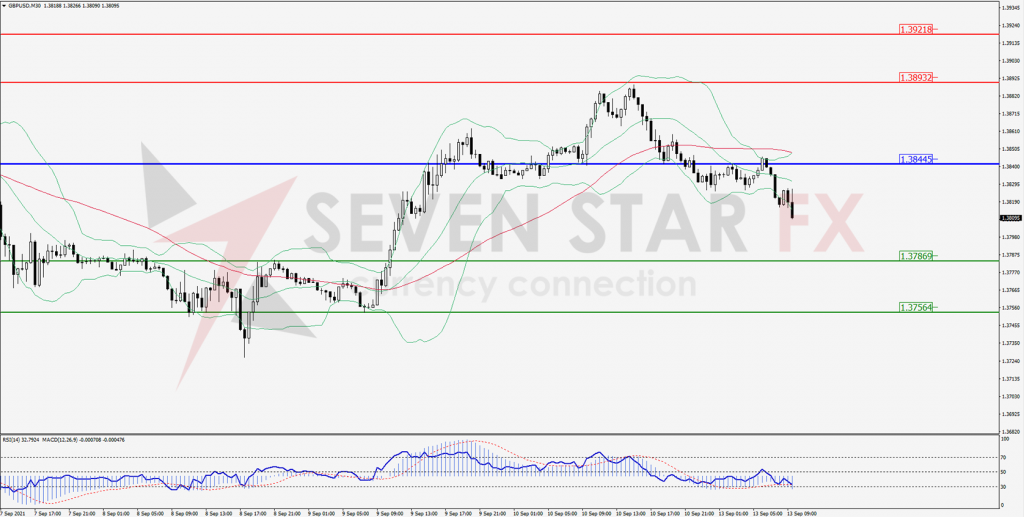
Green Lines Indicate Resistance Levels – Red Lines Indicates Support Levels
Light Blue is a Pivot Point – Black represents the price when the report was produced
USD/JPY Intraday: Support at 109.945
Our pivot point is at 109.945
Preferable Price Action: Buy position above pivot with the target at 110.256 and 110.409 in extension.
Alternative Price Action: The downside breakout of the pivot would call for 109.651 and 109.502.
Comment: Price above its 20MA & 55MA and MACD in positive territory.
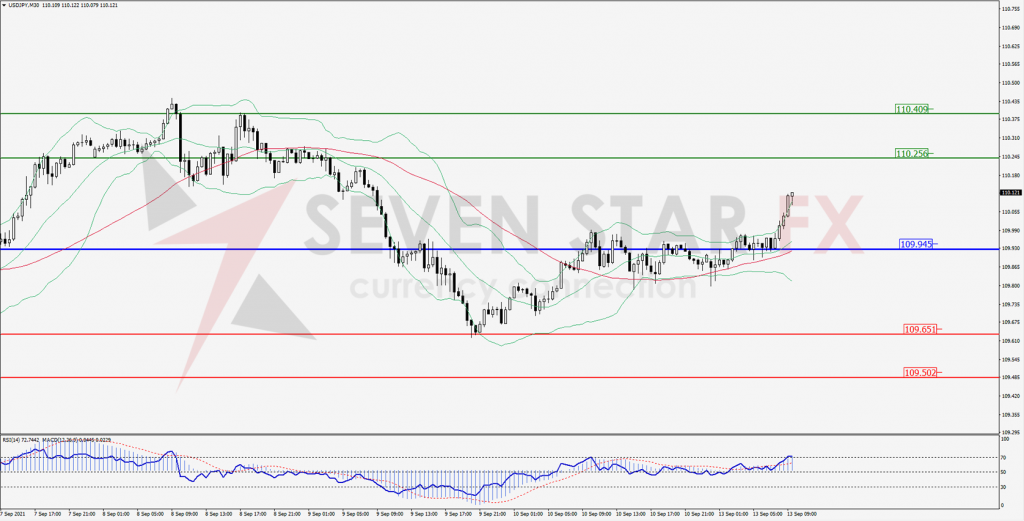
Green Lines Indicate Resistance Levels – Red Lines Indicates Support Levels
Light Blue is a Pivot Point – Black represents the price when the report was produced
AUD/USD Intraday: In a consolidation zone
Our pivot point is at 0.73679
Preferable Price Action: Sell Positions below pivot with targets at 0.73174 & 0.72971 in extension.
Alternative Price Action: Above pivot looks for a further upside with 0.74181 & 0.74397 as targets.
Comment: Pair below its 55MA & 20MA and RSI below 50 levels.
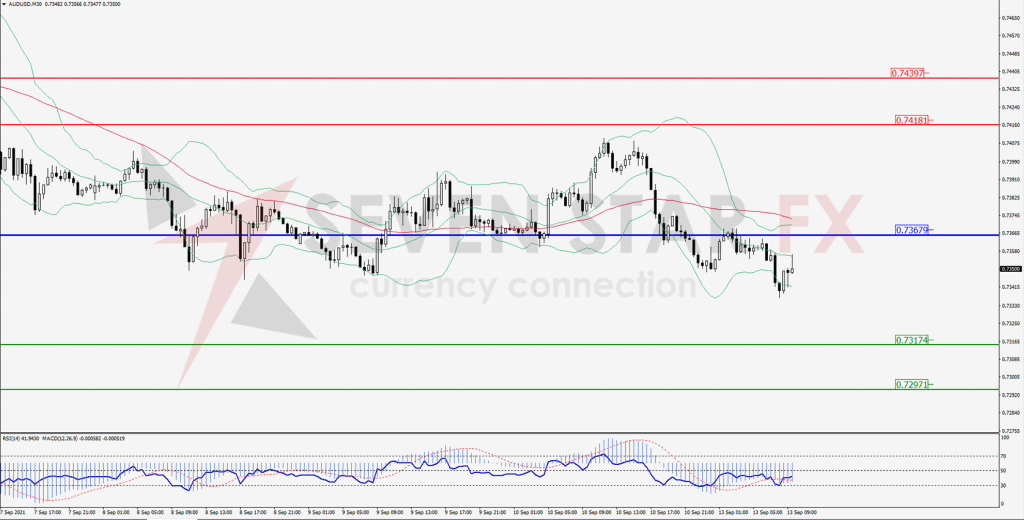
Green Lines Indicate Resistance Levels – Red Lines Indicates Support Levels
Light Blue is a Pivot Point – Black represents the price when the report was produced
CRUDEOIL Intraday: Break resistance level
Our pivot point is at 69.34
Preferable Price Action: Above pivots buy Oil with 70.81 & 71.53 as targets.
Alternative Price Action: Sell crude below pivot with targets at 67.93 and 67.13 in extension.
Comment: Crude is above its 55MA & 20MA and MACD in the positive territory.
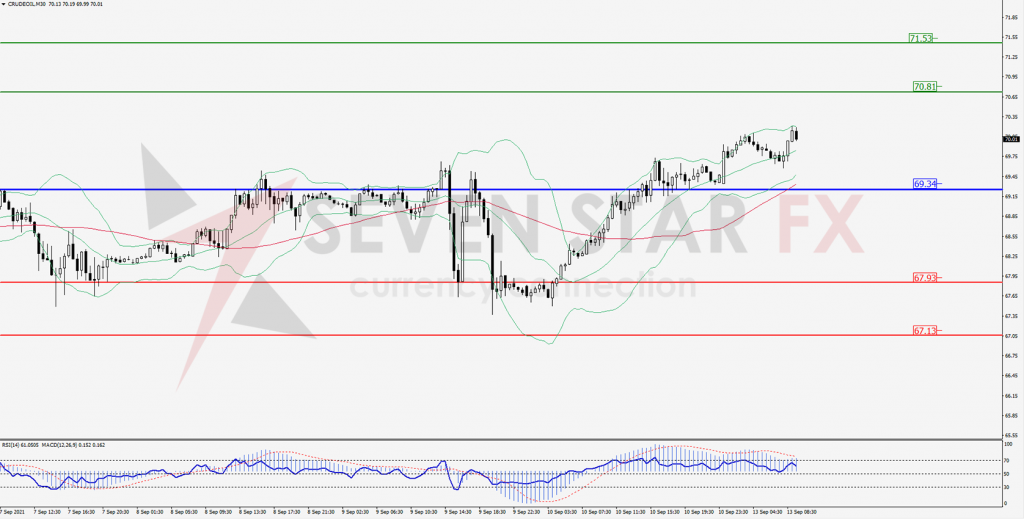
Green Lines Indicate Resistance Levels – Red Lines Indicates Support Levels
Light Blue is a Pivot Point – Black represents the price when the report was produced
XAU/USD Intraday: Resistance level at 1797.17
Our pivot point is 1797.17
Preferable Price Action: Further downside to 1780.86 and 1772.17.
Alternative Price Action: If the price gives a upside breakout of a pivot, then the price extends to 1812.40 and 1820.80.
Comment: MACD in positive territory and price below its 20MA & 55MA.
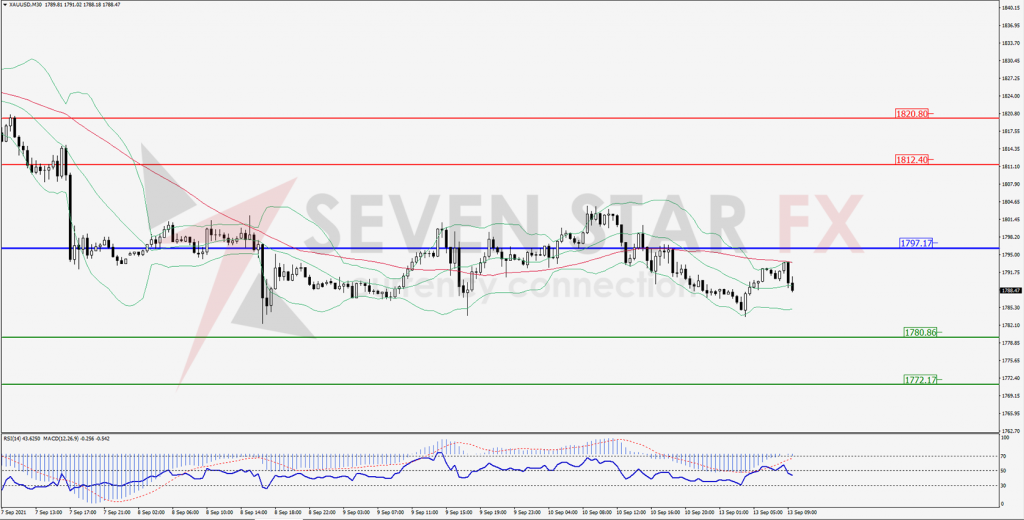
Green Lines Indicate Resistance Levels – Red Lines Indicates Support Levels
Light Blue is a Pivot Point – Black represents the price when the report was produced
Dow Jones Intraday: Resistance at 34,885.00
Our pivot point is 34,885.00
Preferable Price Action: Take short positions below pivot with targets at 34,607.00 & 34,478.00.
Alternative Price Action: above 34,885.00 looks for further upside to 35,142.00 & 35,268.00.
Comment: Price below it 55MA and RSI below 50 levels.
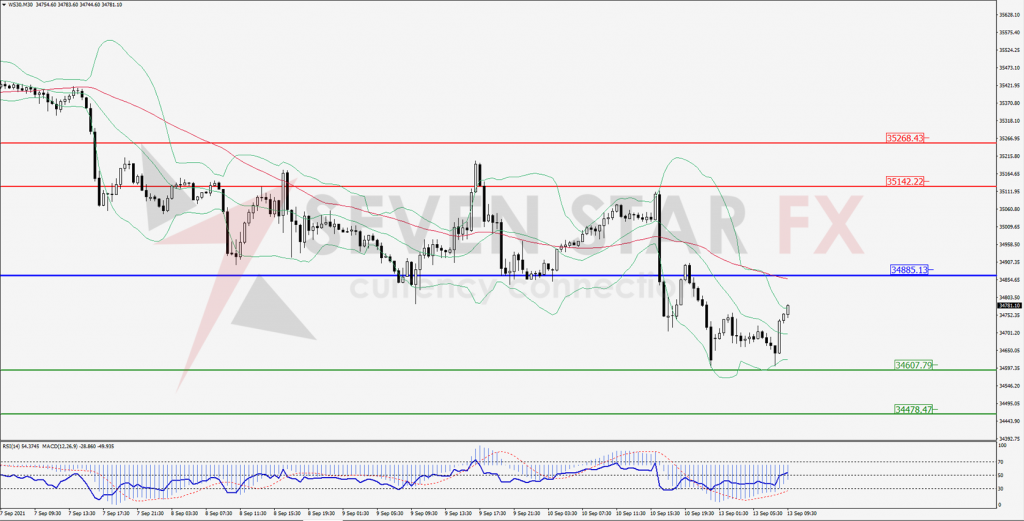
Green Lines Indicate Resistance Levels – Red Lines Indicates Support Levels
Light Blue is a Pivot Point – Black represents the price when the report was produced