Market Wrap: Stocks, Bonds, Commodities
The S&P 500 and Nasdaq ended higher on Wednesday, led by gains in shares of big growth names like Amazon.com and Microsoft, but JPMorgan shares fell along with other bank shares and weighed on the market.
The Dow Jones Industrial Average flat 34,377.81, the S&P 500 gained 13.15 points (0.30%) to 4,363.8 and the Nasdaq Composite added 105.71 points (0.73%) to 14,571.64.
Asian stocks gained on Wednesday as concerns related to increasing power prices fuelling inflation issues and rise hopes America would taper its emergency bond-buying.
MSCI’s index of Asia-Pacific stocks outside Japan is rose 0.42% to 805.7 levels. Australian index gained 0.54% to 7,311.70. Japanese Nikkei Index advances 1.43% to 28,541.50.
European stocks were higher on Thursday, with the Stoxx Europe 50 Index rose 0.41% to 4,071.55, Germany’s DAX gained 0.55% to 15,229.50, and France’s CAC slipped 0.05% to 6,510.10, and U.K.’s FTSE 100 lost 0.88% to 7,083.96.
Benchmark 10-year U.S. Treasury rose as demand for safe assets grows again, today 10-year bond yields rose 0.12% to 1.551.
Oil prices climbed on Thursday, reversing previous losses, as a bigger-than-expected draw in U.S. gasoline and distillate stocks prompted buying.
Spot Brent crude oil gained 0.85% to $83.8 per barrel. US West Texas Intermediate crude rose 0.83% to $81.11 a barrel.
The yellow metal traded 0.13% lower to 172.25 dollars per ounce.
Market Wrap: Forex
The dollar fell from its one-year high on Wednesday as longer-dated Treasury yields dipped after U.S. inflation data showed prices rose solidly last month, while the minutes from the Federal Reserve’s September meeting confirm tapering will begin soon.
Today, the U.S. dollar index measures the greenback against a trade-weighted basket of six major currencies, which flat to 94.358.
The Euro US Dollar (EUR/USD) is a widely traded pair that is flat today. This left the pairing trading around $1.15890.
The Japanese yen fell against the U.S. dollar on Thursday as the stock pushes higher. Today US/JPY rose 0.27% to 113.510 level.
Another commodity-related currency higher against the U.S dollar, AUD/USD up 0.13% to 0.73870, and NZD/USD gained 0.25% to 0.69760 level.
EUR/USD Intraday: Support at 1.15805
Our pivot point is at 1.15805
Preferable Price Action: Take long positions above pivot level with targets at 1.16223 & 1.16412 in extension.
Alternative Price Action: Below pivot looks for a further downside to 1.15388 & 1.15218.
Comment: Pair above its 55MA & 20MA and RSI above 50 levels.
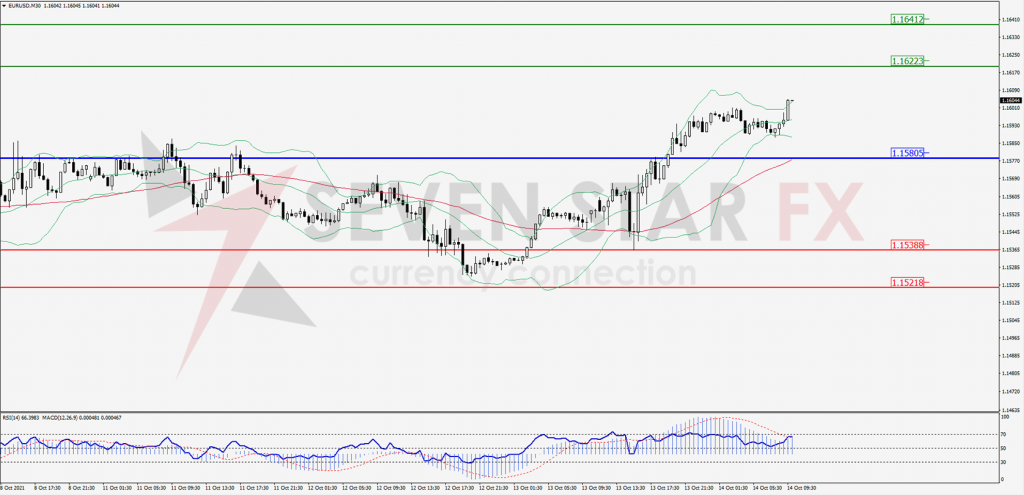
Green Lines Indicate Resistance Levels – Red Lines Indicates Support Levels
Light Blue is a Pivot Point – Black represents the price when the report was produced
GBP/USD Intraday: Break consolidation area
Our pivot point is at 1.36353
Preferable Price Action: Buy positions above pivot with targets at 1.37215 & 1.37690 in extension.
Alternative Price Action: The price below pivot would call for further downside to 1.35500 & 1.35122.
Comment: Pair above its 50MA & 20MA and RSI above 50 levels.
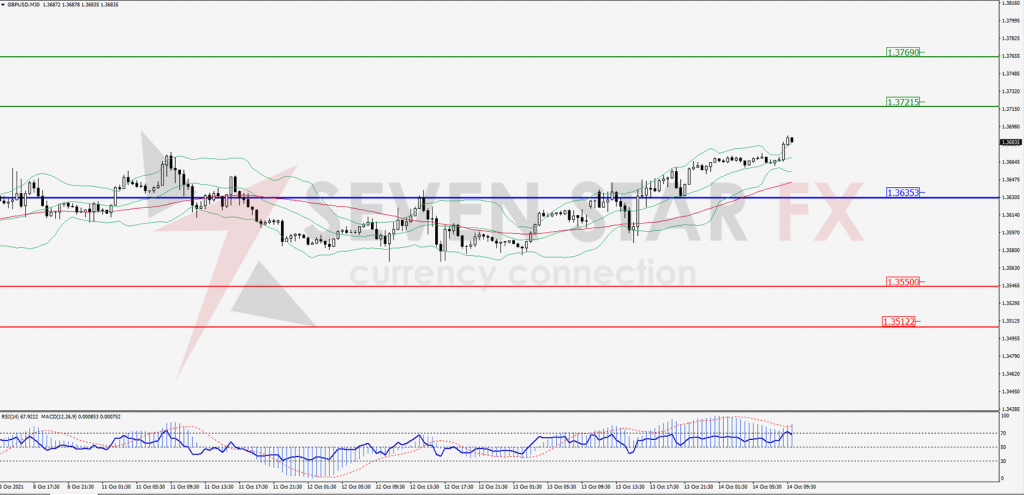
Green Lines Indicate Resistance Levels – Red Lines Indicates Support Levels
Light Blue is a Pivot Point – Black represents the price when the report was produced
USD/JPY Intraday: Trend on the upside
Our pivot point is at 113.123
Preferable Price Action: Buy position above pivot with the target at 114.302 and 114.821 in extension.
Alternative Price Action: The downside breakout of the pivot would call for 112.084 and 111.546.
Comment: Price above its 55MA & 20MA and MACD in positive territory.
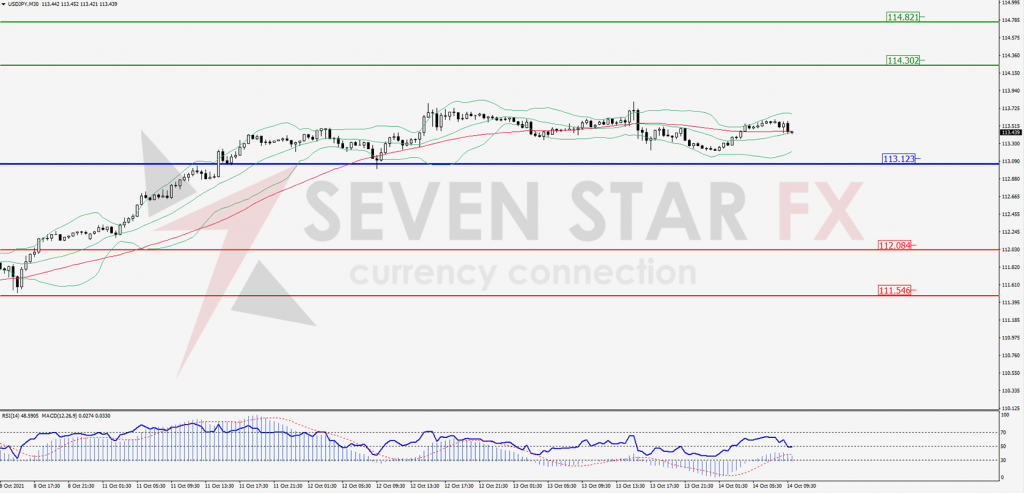
Green Lines Indicate Resistance Levels – Red Lines Indicates Support Levels
Light Blue is a Pivot Point – Black represents the price when the report was produced
AUD/USD Intraday: Support at 0.73603
Our pivot point is at 0.73603
Preferable Price Action: Buy Positions above pivot with targets at 0.74187 & 0.74441 in extension.
Alternative Price Action: Below pivot looks for a further downside with 0.72893 & 0.72636 as targets.
Comment: Pair above its 55MA & 20MA and RSI above 50 levels.
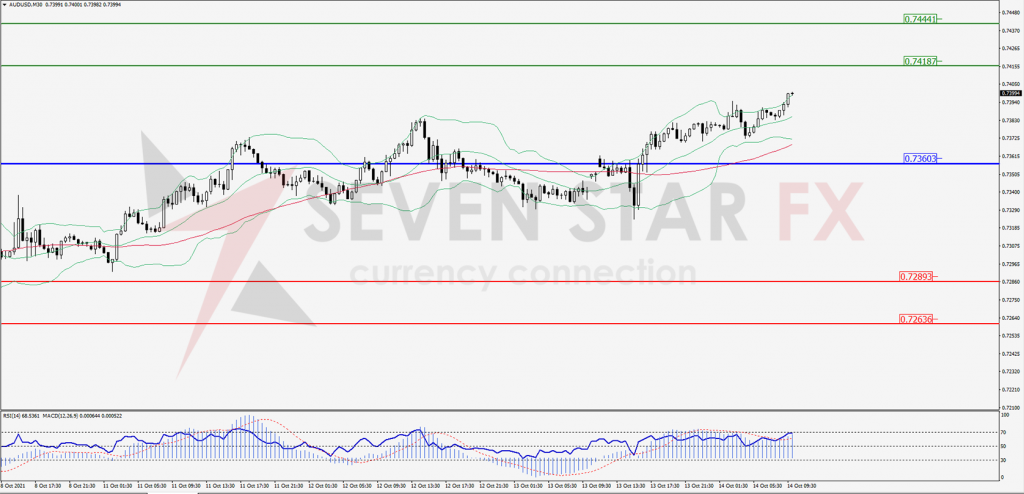
Green Lines Indicate Resistance Levels – Red Lines Indicates Support Levels
Light Blue is a Pivot Point – Black represents the price when the report was produced
CRUDEOIL Intraday: Support at 79.59
Our pivot point is at 79.59
Preferable Price Action: Above pivots buy Oil with 81.59 & 82.53 as targets.
Alternative Price Action: Buy crude below pivot with targets at 77.65 and 76.77 in extension.
Comment: Crude is above its 55MA and MACD in the positive territory.
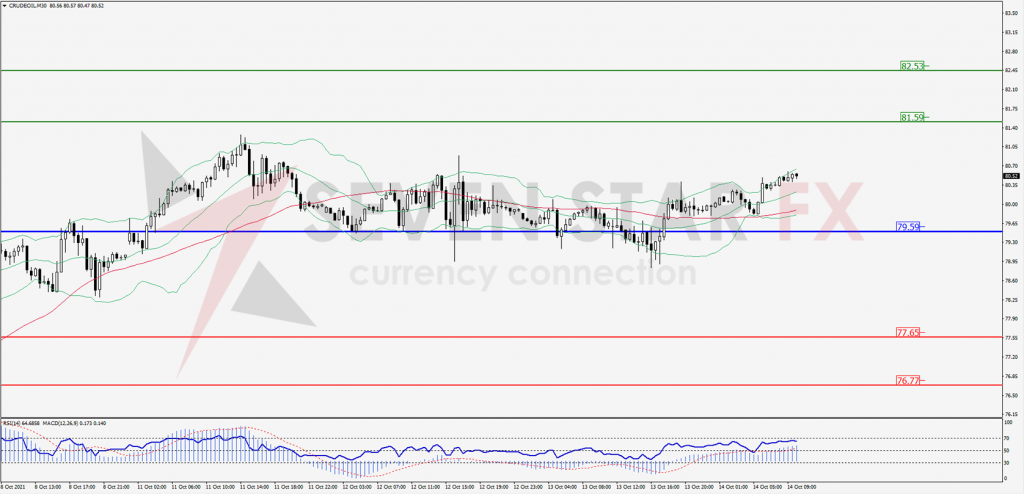
Green Lines Indicate Resistance Levels – Red Lines Indicates Support Levels
Light Blue is a Pivot Point – Black represents the price when the report was produced
XAU/USD Intraday: Strong trend on the upside
Our pivot point is 1782.60
Preferable Price Action: Further upside to 1802.85 and 1813.11.
Alternative Price Action: If the price gives a downside breakout of a pivot, then the price extends to 1762.35 and 1749.28.
Comment: MACD in positive territory and price above its 20MA & 55MA.
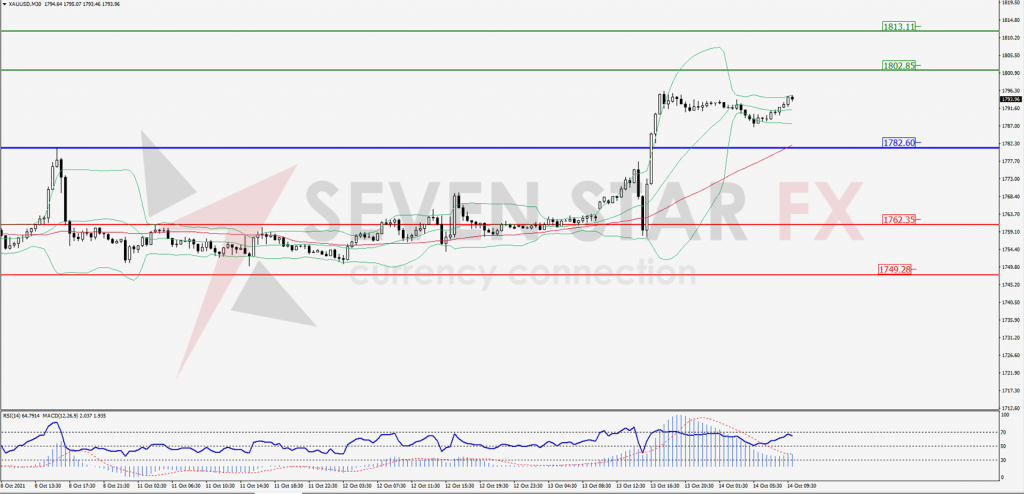
Green Lines Indicate Resistance Levels – Red Lines Indicates Support Levels
Light Blue is a Pivot Point – Black represents the price when the report was produced
Dow Jones Intraday: Break resistance level
Our pivot point is 34,428.00
Preferable Price Action: Take long positions above pivot with targets at 34,889.00 & 35,107.00.
Alternative Price Action: Below 34,428.00 looks for further downside to 33,961.00 & 33,740.00.
Comment: Price above its 55MA & 20MA and RSI above 50 levels.
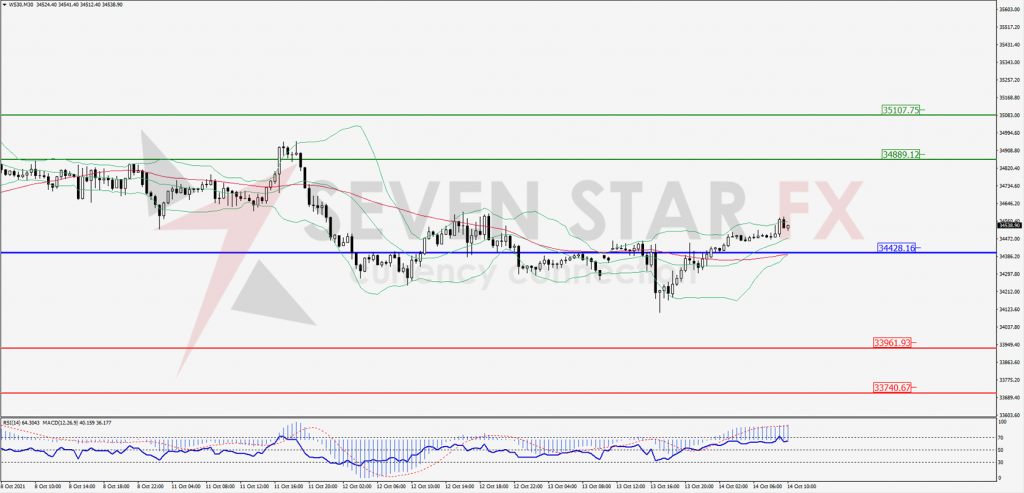
Green Lines Indicate Resistance Levels – Red Lines Indicates Support Levels
Light Blue is a Pivot Point – Black represents the price when the report was produced