Market Wrap: Stocks, Bonds, Commodities
American major stock indices closed down on Tuesday, extending decline as traders concerns grow about third-quarter earnings.
The Dow Jones Industrial Average slipped 117.72 points (0.34%) to 34,378.34, the S&P 500 decline 10.54 points (0.24%) to 4,350.65 and the Nasdaq Composite fell 20.28 points (0.14%) to 14,465.93.
Asian stocks gained on Wednesday as concerns related to increasing power prices fuelling inflation issues and rise hopes America would taper its emergency bond-buying..
MSCI’s index of Asia-Pacific stocks outside Japan is rose 0.32% to 800.37 levels. Australian index fell 0.11% to 7,272.50. Japanese Nikkei Index lost 0.22% to 28,171.50.
European stocks were mixed on Wednesday, with the Stoxx Europe 50 Index rose 0.41% to 4,071.55, Germany’s DAX gained 0.55% to 15,229.50, and France’s CAC slipped 0.05% to 6,510.10, and U.K.’s FTSE 100 lost 0.88% to 7,083.96.
Benchmark 10-year U.S. Treasury rose as demand for safe assets grows again, today 10-year bond yields rose 0.14% to 1.582.
Oil prices slipped on Wednesday, amid worries that soaring coal and natural gas prices in China, India and Europe will stoke inflation and slow global growth, reducing oil demand.
Spot Brent crude oil gained 0.05% to $83.47 per barrel. US West Texas Intermediate crude rose 0.07% to $80.67 a barrel.
The yellow metal traded 0.20% higher to 1762.85 dollars per ounce.
Market Wrap: Forex
Today, the U.S. dollar index measures the greenback against a trade-weighted basket of six major currencies, which fell 0.17% to 94.358.
The Euro US Dollar (EUR/USD) is a widely traded pair that is rose 0.22% today. This left the pairing trading around $1.15510.
The Japanese yen rose against the U.S. dollar on Wednesday as the stock pushes lower. Today US/JPY fell 0.11% to 113.460 level.
Another commodity-related currency mixed against the U.S dollar, AUD/USD down 0.17% to 0.73360, and NZD/USD gained 0.06% to 0.69360 level.
EUR/USD Intraday: Support at 1.15429
Our pivot point is at 1.15429
Preferable Price Action: Take long positions above pivot level with targets at 1.15704 & 1.15876 in extension.
Alternative Price Action: Below pivot looks for a further downside to 1.15170 & 1.15015.
Comment: Pair above its 55MA & 20MA and RSI above 50 levels.
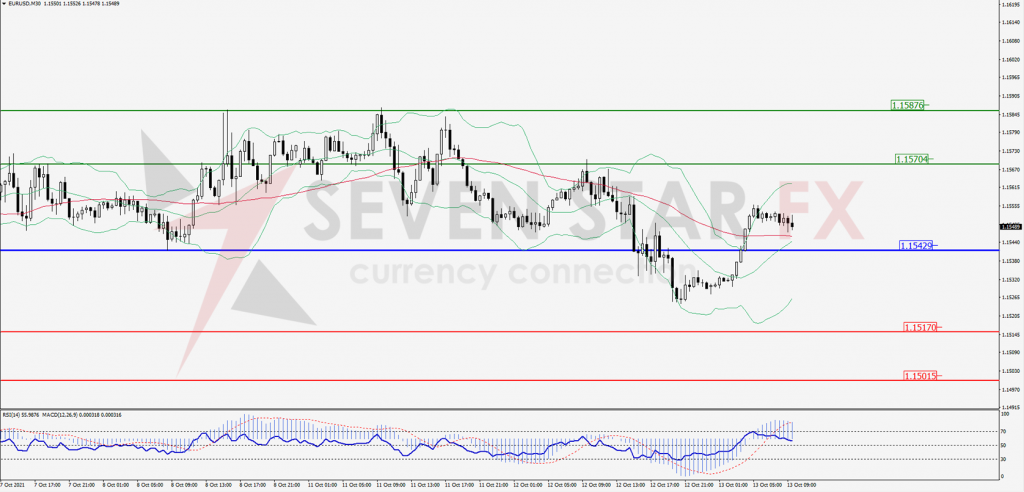
Green Lines Indicate Resistance Levels – Red Lines Indicates Support Levels
Light Blue is a Pivot Point – Black represents the price when the report was produced
GBP/USD Intraday: In a consolidation zone
Our pivot point is at 1.35774
Preferable Price Action: Buy positions above pivot with targets at 1.36721 & 1.37155 in extension.
Alternative Price Action: The price below pivot would call for further downside to 1.35016 & 1.34525.
Comment: Pair above its 20MA and RSI above 50 levels.
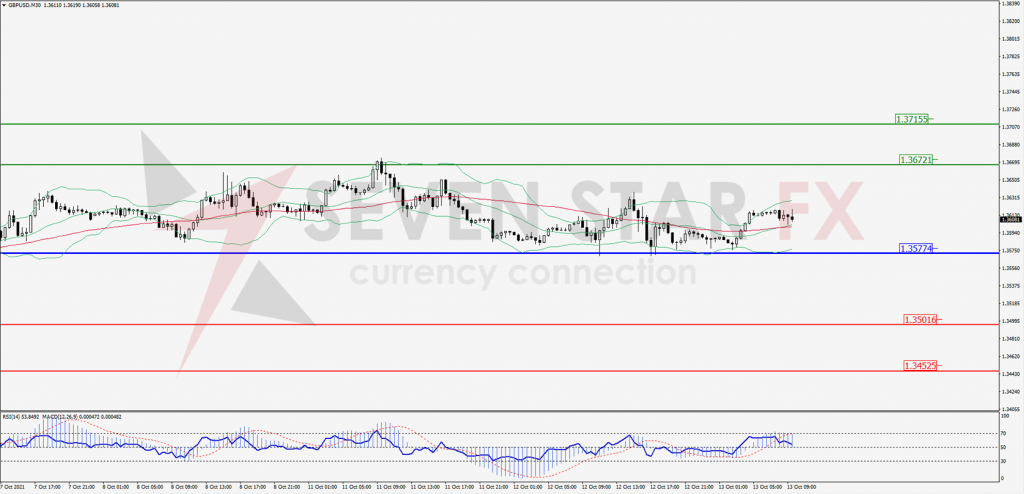
Green Lines Indicate Resistance Levels – Red Lines Indicates Support Levels
Light Blue is a Pivot Point – Black represents the price when the report was produced
USD/JPY Intraday: Trend on the upside
Our pivot point is at 113.116
Preferable Price Action: Buy position above pivot with the target at 114.116 and 114.674 in extension.
Alternative Price Action: The downside breakout of the pivot would call for 112.091 and 111.539.
Comment: Price above its 55MA & 20MA and MACD in negative territory.
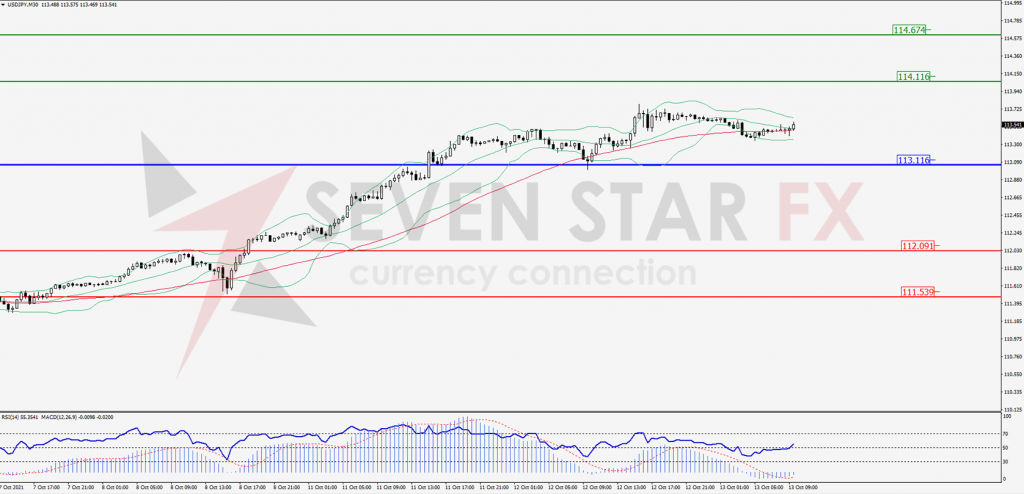
Green Lines Indicate Resistance Levels – Red Lines Indicates Support Levels
Light Blue is a Pivot Point – Black represents the price when the report was produced
AUD/USD Intraday: Support at 0.73175
Our pivot point is at 0.73175
Preferable Price Action: Buy Positions above pivot with targets at 0.73741 & 0.73982 in extension.
Alternative Price Action: Below pivot looks for a further downside with 0.72639 & 0.72379 as targets.
Comment: Pair below its 55MA & 20MA and RSI below 50 levels.
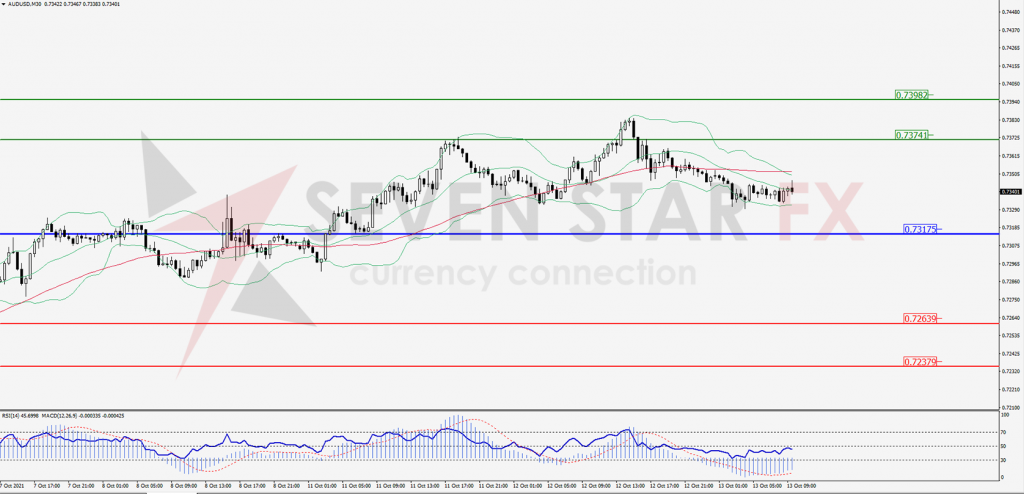
Green Lines Indicate Resistance Levels – Red Lines Indicates Support Levels
Light Blue is a Pivot Point – Black represents the price when the report was produced
CRUDEOIL Intraday: Resistance at 80.83
Our pivot point is at 80.83
Preferable Price Action: Below pivots sell Oil with 78.17 & 76.81 as targets.
Alternative Price Action: Buy crude above pivot with targets at 83.68 and 84.94 in extension.
Comment: Crude is below its 55MA and MACD in the negative territory.
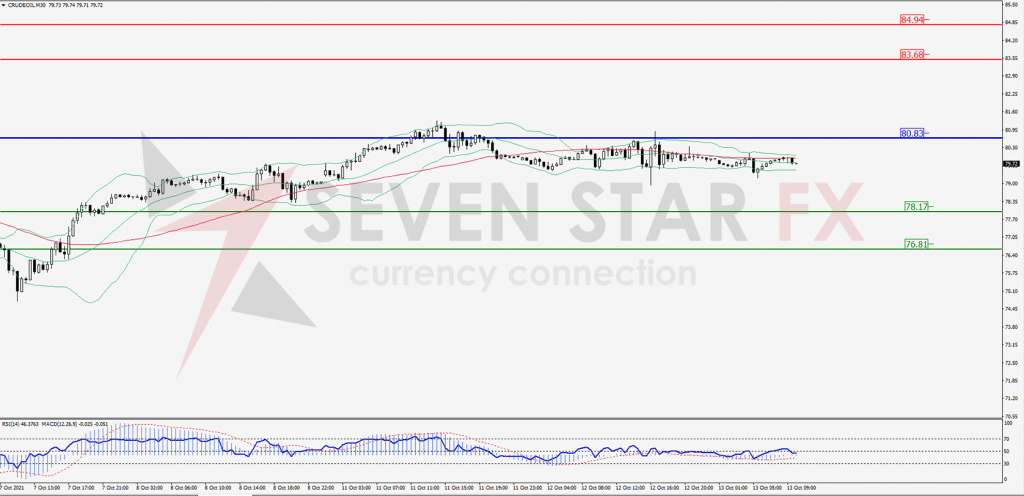
Green Lines Indicate Resistance Levels – Red Lines Indicates Support Levels
Light Blue is a Pivot Point – Black represents the price when the report was produced
XAU/USD Intraday: In a consolidation zone
Our pivot point is 1756.39
Preferable Price Action: Further upside to 1771.47 and 1779.46.
Alternative Price Action: If the price gives a downside breakout of a pivot, then the price extends to 1740.92 and 1732.15.
Comment: MACD in positive territory and price above its 20MA & 55MA.
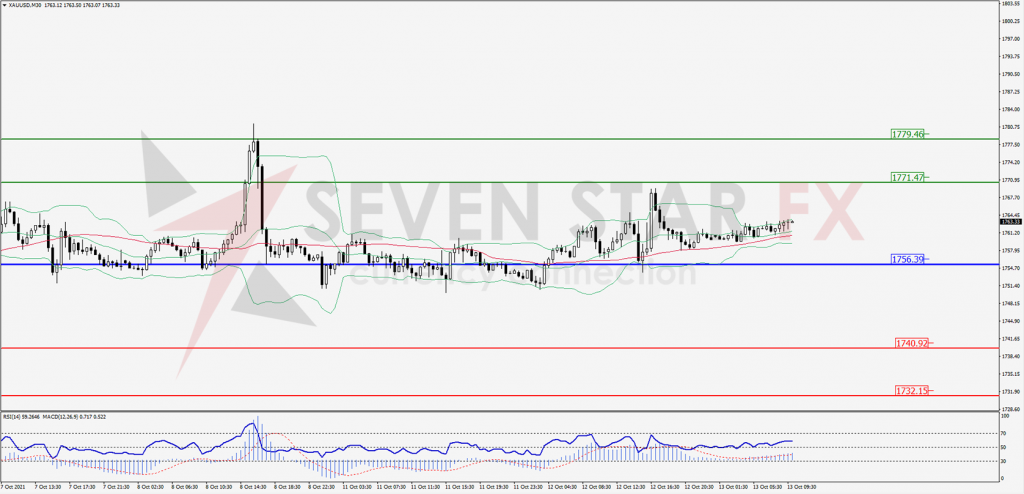
Green Lines Indicate Resistance Levels – Red Lines Indicates Support Levels
Light Blue is a Pivot Point – Black represents the price when the report was produced
Dow Jones Intraday: Trend on the downside
Our pivot point is 34,472.00
Preferable Price Action: Take short positions below pivot with targets at 34,040.00 & 33,830.00.
Alternative Price Action: Above 34,472.00 looks for further downside to 34,040.00 & 33,830.00.
Comment: Price below its 55MA & 20MA and RSI below 50 levels.
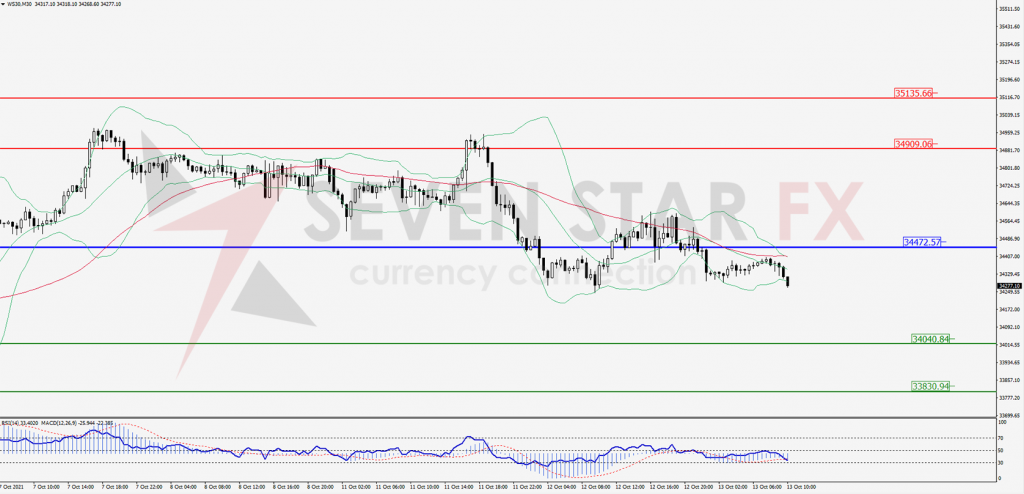
Green Lines Indicate Resistance Levels – Red Lines Indicates Support Levels
Light Blue is a Pivot Point – Black represents the price when the report was produced