Market Wrap: Stocks, Bonds, Commodities
The S&P 500 advanced in the last trading session, as companies including Morgan Stanley and UnitedHealth climbed following strong quartly earning results.
The Dow Jones Industrial Average gained 1.56% to 34,12.56, the S&P 500 gained 74.43 points (1.71%) to 4,438.23 and the Nasdaq Composite added 251.80 points (1.73%) to 14,823.40.
MSCI’s index of Asia-Pacific stocks outside Japan is rose 1.21% to 815.69 levels. Australian index gained 0.6% to 7,362.00. Japanese Nikkei Index advances 1.82% to 29,071.00.
European stocks were higher on Friday, with the Stoxx Europe 50 Index rose 0.48% to 4,168.35, Germany’s DAX gained 0.19% to 15,490.50, and France’s CAC up 0.40% to 6,711.50, and U.K.’s FTSE 100 jumped 0.23% to 7,224.10.
Benchmark 10-year U.S. Treasury rose as demand for safe assets grows again, today 10-year bond yields rose 0.96% to 1.534.
Oil rates jumped on Friday, heading toward a rising of more than 2% for this week, on increasing signs of tight supply of oil over high demand from worldwide.
Spot Brent crude oil gained 1.02% to $84.86 per barrel. US West Texas Intermediate crude rose 0.5% to $82.08 a barrel.
The yellow metal traded 0.13% lower to 172.25 dollars per ounce.
Market Wrap: Forex
The US dollar falling back from a one-year high as traders turned their attention to when the U.S. Federal Reserve will start raising interest rates.
Today, the U.S. dollar index measures the greenback against a trade-weighted basket of six major currencies, which flat to 93.945.
The Euro US Dollar (EUR/USD) is a widely traded pair that is flat today. This left the pairing trading around $1.16080.
The Japanese yen fell against the U.S. dollar on Friday as the stock pushes higher. Today US/JPY rose 0.33% to 114.000 level.
Another commodity-related currency higher against the U.S dollar, AUD/USD up 0.11% to 0.74220, and NZD/USD gained 0.28% to 0.70530 level.
EUR/USD Intraday: Support at 1.15906
Our pivot point is at 1.15906
Preferable Price Action: Take long positions above pivot level with targets at 1.16312 & 1.16504 in extension.
Alternative Price Action: Below pivot looks for a further downside to 1.1538 & 1.15218.
Comment: Pair above its 55MA & 20MA and RSI above 50 levels.
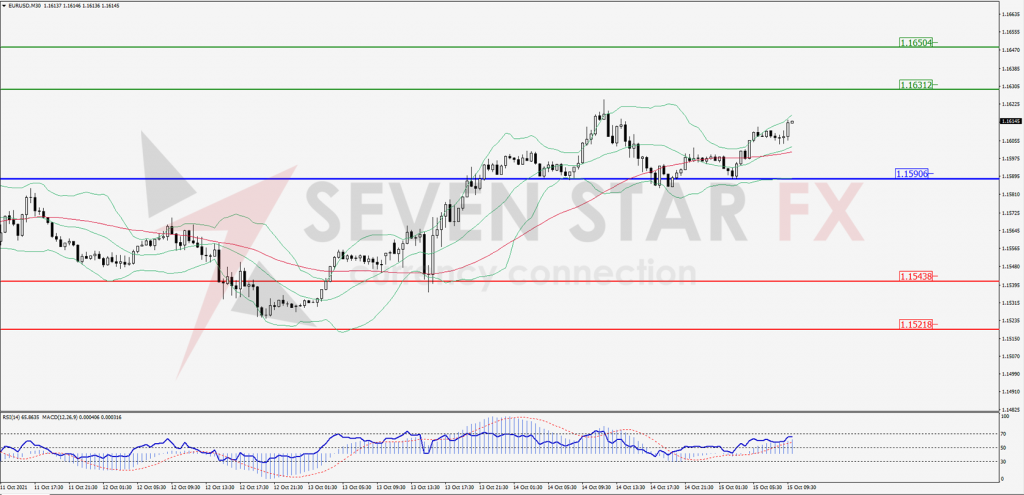
Green Lines Indicate Resistance Levels – Red Lines Indicates Support Levels
Light Blue is a Pivot Point – Black represents the price when the report was produced
GBP/USD Intraday: Break consolidation area
Our pivot point is at 1.36587
Preferable Price Action: Buy positions above pivot with targets at 1.37303 & 1.37682 in extension.
Alternative Price Action: The price below pivot would call for further downside to 1.35921 & 1.35583.
Comment: Pair above its 50MA & 20MA and RSI above 50 levels.
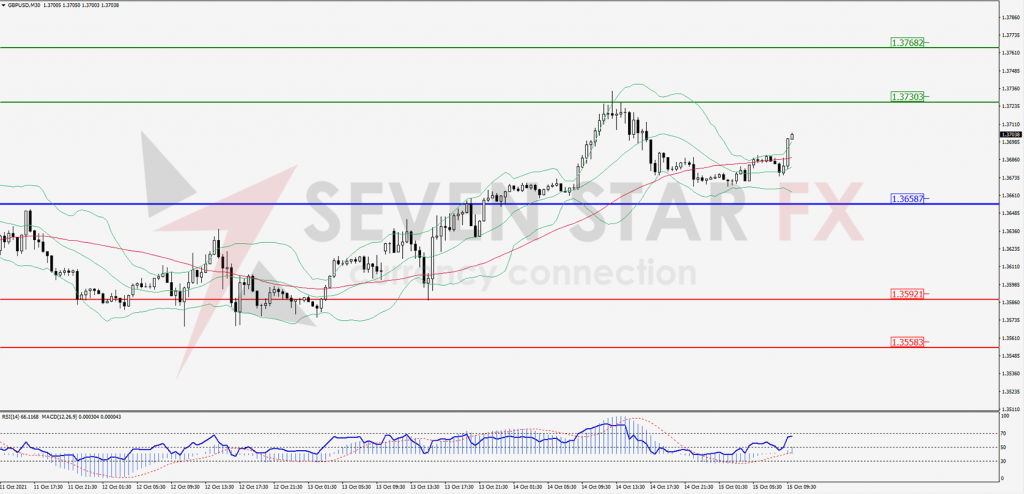
Green Lines Indicate Resistance Levels – Red Lines Indicates Support Levels
Light Blue is a Pivot Point – Black represents the price when the report was produced
USD/JPY Intraday: Break resistance area
Our pivot point is at 113.884
Preferable Price Action: Buy position above pivot with the target at 114.479 and 114.768 in extension.
Alternative Price Action: The downside breakout of the pivot would call for 113.275 and 112.975.
Comment: Price above its 55MA & 20MA and MACD in positive territory.
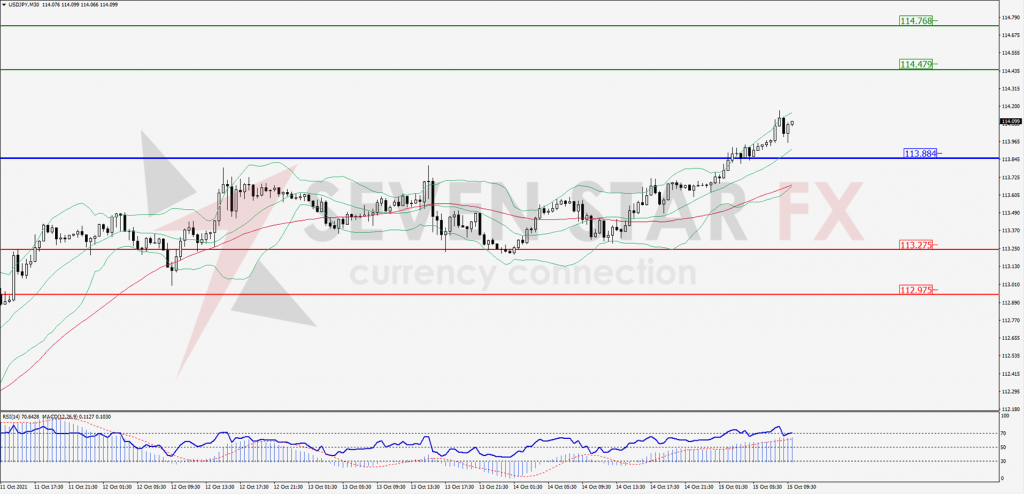
Green Lines Indicate Resistance Levels – Red Lines Indicates Support Levels
Light Blue is a Pivot Point – Black represents the price when the report was produced
AUD/USD Intraday: Support at 0.74099
Our pivot point is at 0.74099
Preferable Price Action: Buy Positions above pivot with targets at 0.74457 & 0.74638 in extension.
Alternative Price Action: Below pivot looks for a further downside with 0.72742 & 0.72527 as targets.
Comment: Pair above its 55MA & 20MA and RSI above 50 levels.
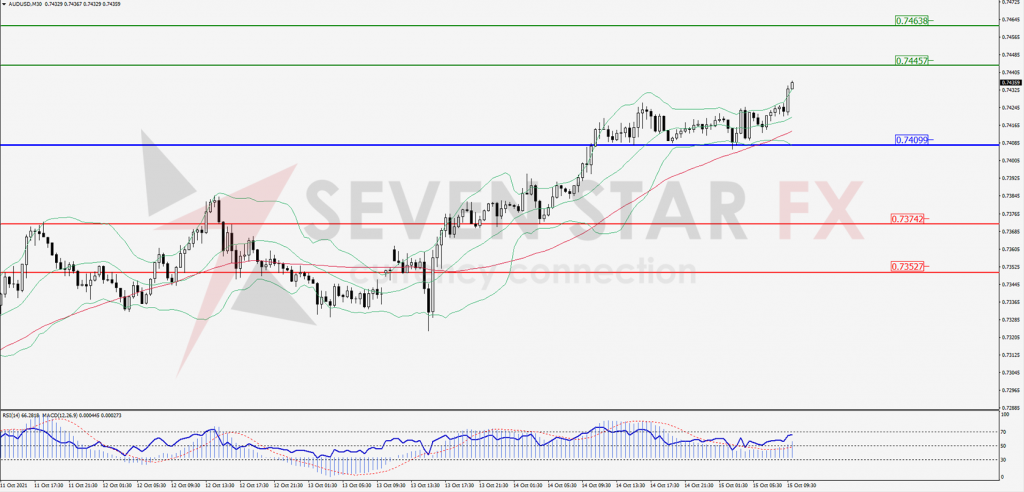
Green Lines Indicate Resistance Levels – Red Lines Indicates Support Levels
Light Blue is a Pivot Point – Black represents the price when the report was produced
CRUDEOIL Intraday: Support at 80.60
Our pivot point is at 80.60
Preferable Price Action: Above pivots buy Oil with 82.32 & 83.13 as targets.
Alternative Price Action: Sell crude below pivot with targets at 78.72 and 77.73 in extension.
Comment: Crude is above its 55MA and MACD in the positive territory.
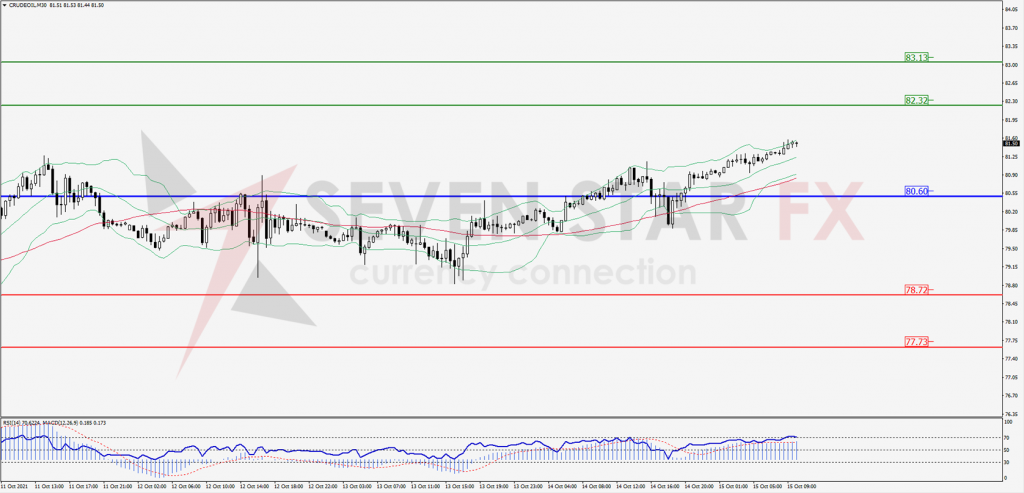
Green Lines Indicate Resistance Levels – Red Lines Indicates Support Levels
Light Blue is a Pivot Point – Black represents the price when the report was produced
XAU/USD Intraday: Strong trend on the upside
Our pivot point is 1782.16
Preferable Price Action: Further upside to 1802.48 and 1812.75.
Alternative Price Action: If the price gives a downside breakout of a pivot, then the price extends to 1761.95 and 1748.76.
Comment: MACD in positive territory and price below its 20MA & 55MA.
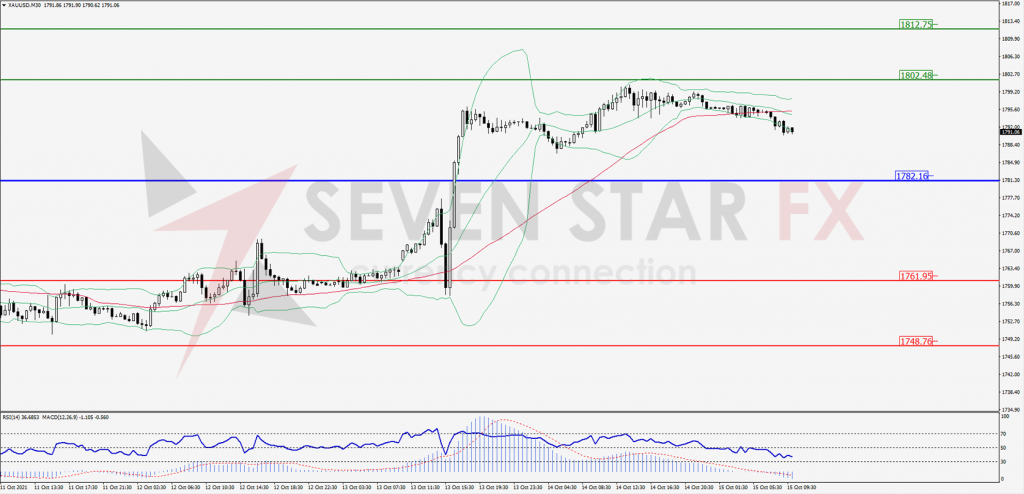
Green Lines Indicate Resistance Levels – Red Lines Indicates Support Levels
Light Blue is a Pivot Point – Black represents the price when the report was produced
Dow Jones Intraday: Trend on the upside
Our pivot point is 34,820.00
Preferable Price Action: Take long positions above pivot with targets at 35,196.00 & 35,388.00.
Alternative Price Action: Below 34,820.00 looks for further downside to 34,436.00 & 34,198.00.
Comment: Price above its 55MA & 20MA and RSI above 50 levels.
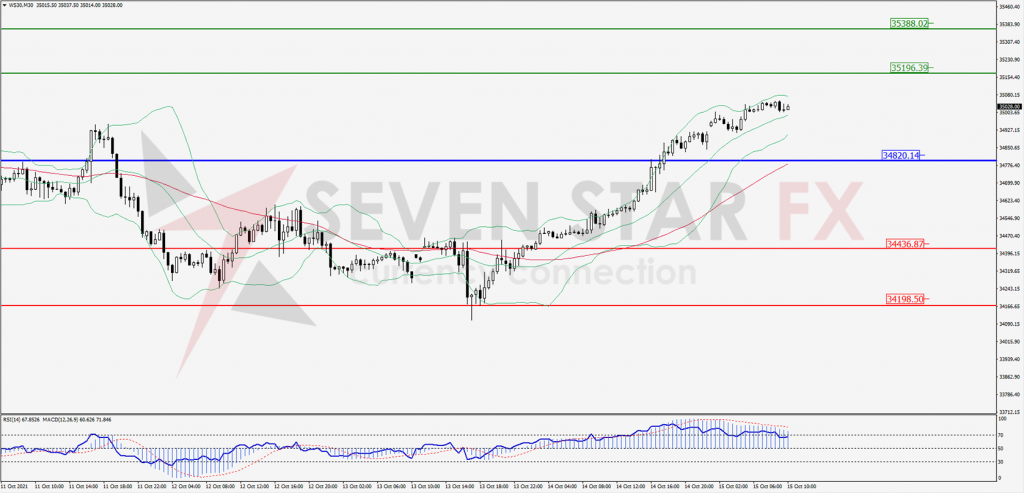
Green Lines Indicate Resistance Levels – Red Lines Indicates Support Levels
Light Blue is a Pivot Point – Black represents the price when the report was produced