Market Wrap: Stocks, Bonds, Commodities
Wall Street ended lower on Thursday after weekly jobless claims fell to a near 18-month low, allaying fears of a slowing economic recovery, but also stoking worries the Fed could move sooner than expected to scale back its accommodative policies.
The Dow Jones Industrial Average fell 0.43% to end at 34,879.38 points, while the S&P 500 lost 0.46% to 4,493.28. The Nasdaq Composite dropped 0.25% to 15,248.30.
Asian shares rallied on Friday after two days of losses but were still in a nervous mood as global investors grapple with how best to interpret central banks’ cautious moves to end stimulus, which also left currency markets quiet.
MSCI’s index of Asia-Pacific stocks outside Japan gained 0.79% to 841.24 levels. Australian index rose 0.50% to 7,406.60. Japanese Nikkei advanced 1.25% to 30,381.84.
European stocks were higher on Friday, with the Stoxx Europe 50 Index up 0.33% to 4,189.50, Germany’s DAX gained 0.16% to 15,650.15, and France’s CAC rose 0.42% to 6,712.61, and U.K.’s FTSE 100 higher 0.30% to 7,045.45.
Benchmark 10-year U.S. Treasury rose as demand for safe assets grows again, today 10-year bond yields jumped 0.95% to 1.312.
Oil prices rose on Friday on growing signs of tightness in U.S. markets after Hurricane Ida hit offshore output, although benchmarks were heading for weekly losses of about 1% after China announced plans to sell crude from its strategic reserves.
Spot Brent crude oil advance 1.04% to $72.19 per barrel. US West Texas Intermediate crude gained 0.94% to $68.75 a barrel.
The yellow metal traded higher 0.22% to 1804.15 dollars per ounce.
Market Wrap: Forex
The dollar headed for its first winning week in three on Friday after rebounding from a payrolls-induced sell-off, as investors continued to ponder the timing of a tapering of Federal Reserve stimulus.
Today, the U.S. dollar index measures the greenback against a trade-weighted basket of six major currencies, which flat to 92.475.
The Euro US Dollar (EUR/USD) is a widely traded pair rose 0.05% today. This left the pairing trading around $1.18290.
The Japanese yen lost against the U.S. dollar on Friday as the stock pushes higher. Today US/JPY rose 0.21% to 109.930 level.
Another commodity-related currency higher against the U.S dollar, AUD/USD up 0.18% to 0.73780, and NZD/USD gained 0.37% to 0.71270 level.
EUR/USD Intraday: Support at 1.18218
Our pivot point is at 1.18218
Preferable Price Action: Take long positions above pivot level with targets at 1.18568 & 1.18749 in extension.
Alternative Price Action: Below pivot looks for a further downside to 1.17940 & 1.17555.
Comment: Pair above its 20MA & 20MA and RSI above 50 levels.
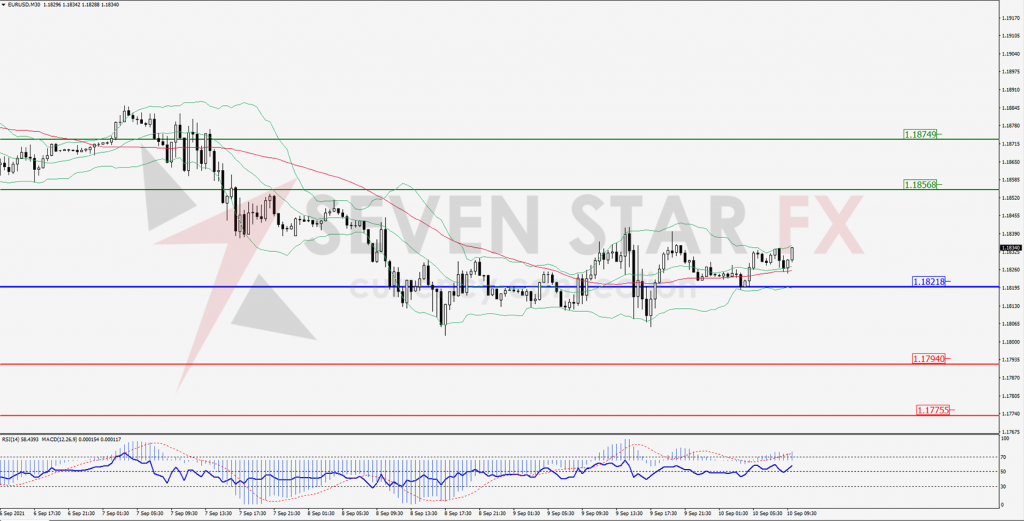
Green Lines Indicate Resistance Levels – Red Lines Indicates Support Levels
Light Blue is a Pivot Point – Black represents the price when the report was produced
GBP/USD Intraday: Trend on the upside
Our pivot point is at 1.38319
Preferable Price Action: Buy positions above pivot with targets at 1.38936 & 1.38218 in extension.
Alternative Price Action: The price below pivot would call for further downside to 1.37695 & 1.37370.
Comment: Pair above its 55MA & 20MA and RSI above 50 levels.
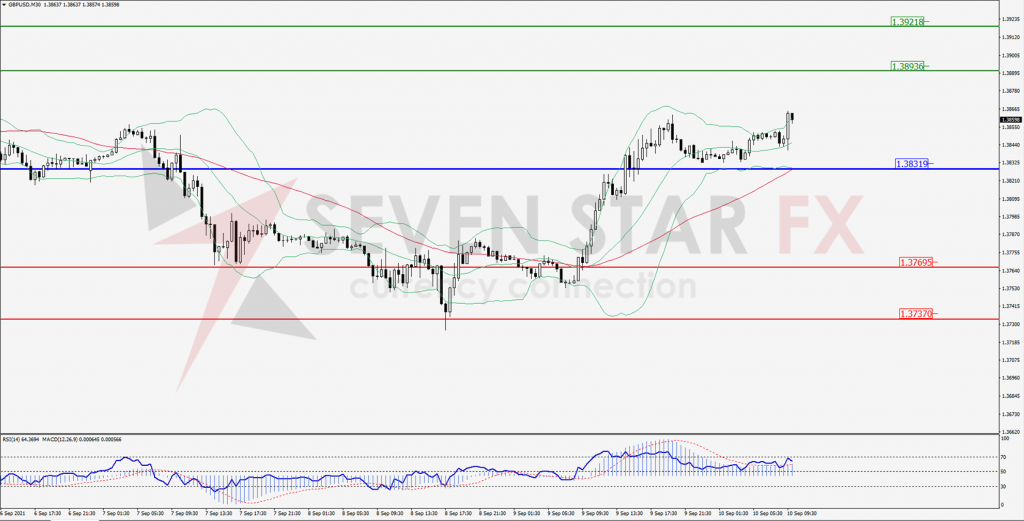
Green Lines Indicate Resistance Levels – Red Lines Indicates Support Levels
Light Blue is a Pivot Point – Black represents the price when the report was produced
USD/JPY Intraday: Support at 109.797
Our pivot point is at 109.797
Preferable Price Action: Buy position above pivot with the target at 110.202 and 110.410 in extension.
Alternative Price Action: The downside breakout of the pivot would call for 109.433 and 109.238.
Comment: Price above its 20MA & 55MA and MACD in positive territory.
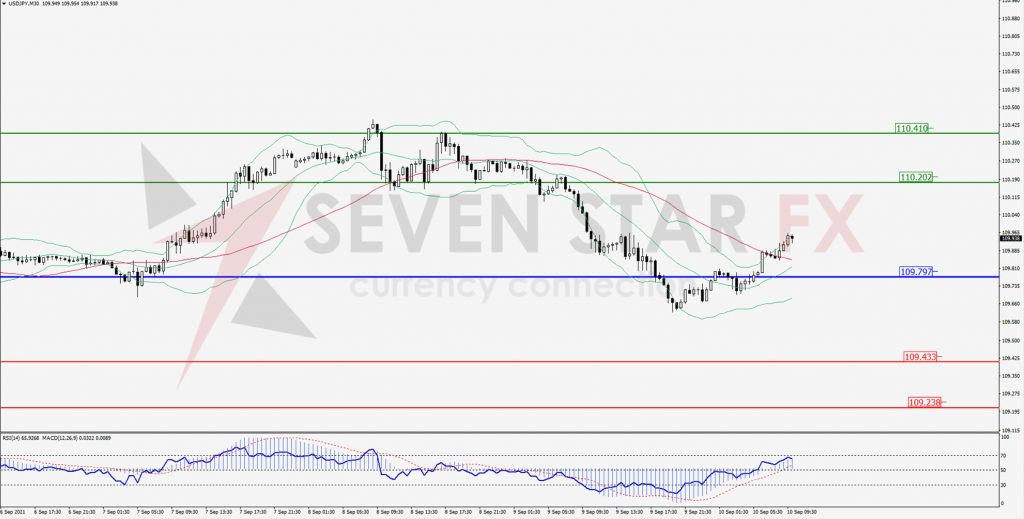
Green Lines Indicate Resistance Levels – Red Lines Indicates Support Levels
Light Blue is a Pivot Point – Black represents the price when the report was produced
AUD/USD Intraday: In a consolidation zone
Our pivot point is at 0.73684
Preferable Price Action: Sell Positions below pivot with targets at 0.73169 & 0.72890 in extension.
Alternative Price Action: Above pivot looks for a further upside with 0.74271 & 0.74579 as targets.
Comment: Pair above its 55MA & 20MA and RSI above 50 levels.
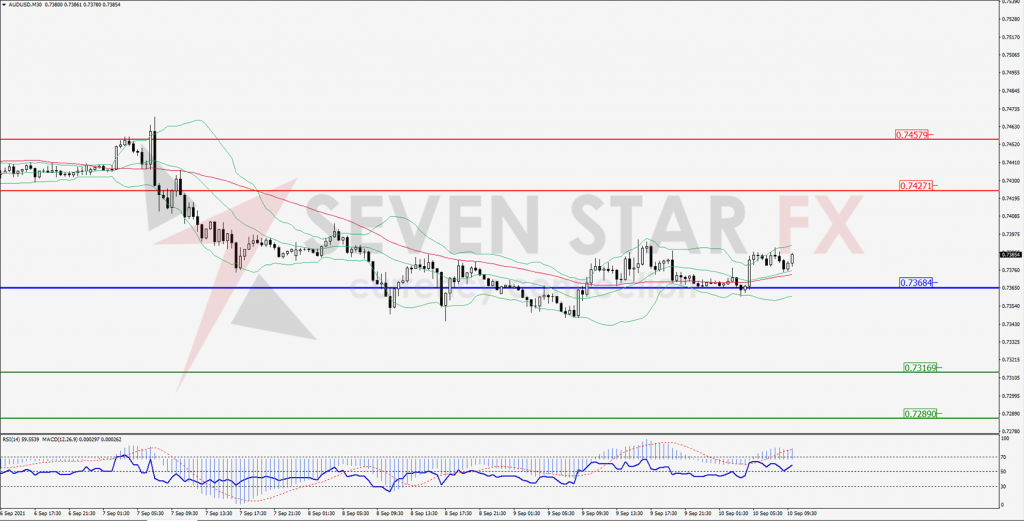
Green Lines Indicate Resistance Levels – Red Lines Indicates Support Levels
Light Blue is a Pivot Point – Black represents the price when the report was produced
CRUDEOIL Intraday: In a consolidation zone
Our pivot point is at 68.13
Preferable Price Action: Above pivots buy Oil with 69.79 & 70.69 as targets.
Alternative Price Action: Sell crude below pivot with targets at 66.43 and 65.52 in extension.
Comment: Crude is above its 55MA & 20MA and MACD in the positive territory.
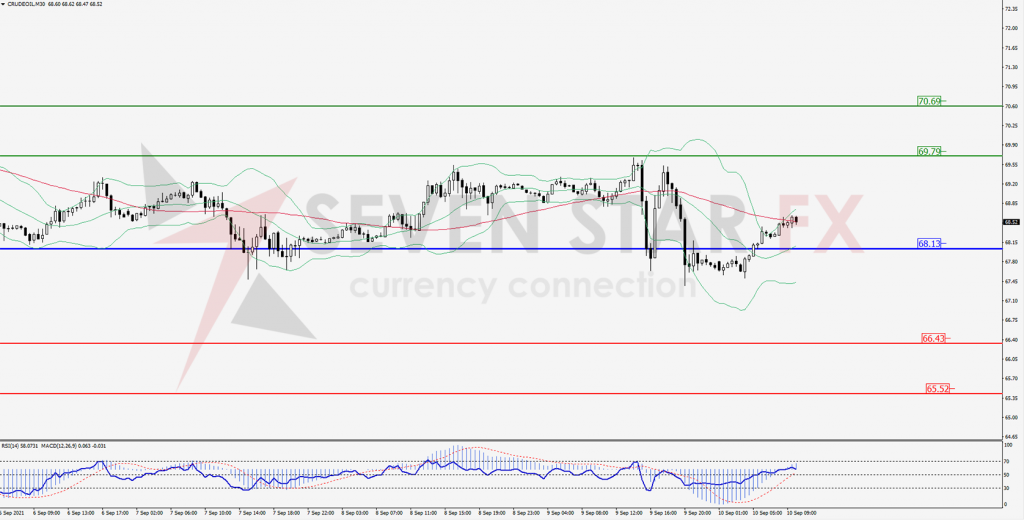
Green Lines Indicate Resistance Levels – Red Lines Indicates Support Levels
Light Blue is a Pivot Point – Black represents the price when the report was produced
XAU/USD Intraday: Break resistance level
Our pivot point is 1793.52
Preferable Price Action: Further upside to 1810.19 and 1818.57.
Alternative Price Action: If the price gives a downside breakout of a pivot, then the price extends to 1779.20 and 1771.38.
Comment: MACD in positive territory and price above its 20MA & 55MA.
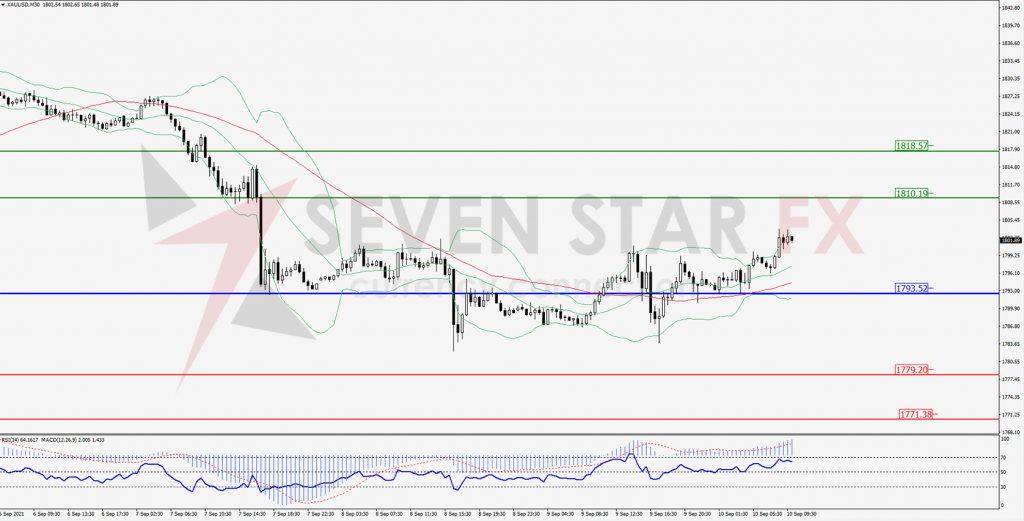
Green Lines Indicate Resistance Levels – Red Lines Indicates Support Levels
Light Blue is a Pivot Point – Black represents the price when the report was produced
Dow Jones Intraday: Resistance at 35,136.00
Our pivot point is 35,136.00
Preferable Price Action: Take short positions below pivot with targets at 34,856.00 & 34,720.00.
Alternative Price Action: above 35,136.00 looks for further upside to 35,363.00 & 35,498.00.
Comment: Price above it 20MA & 55MA and RSI above 50 levels.
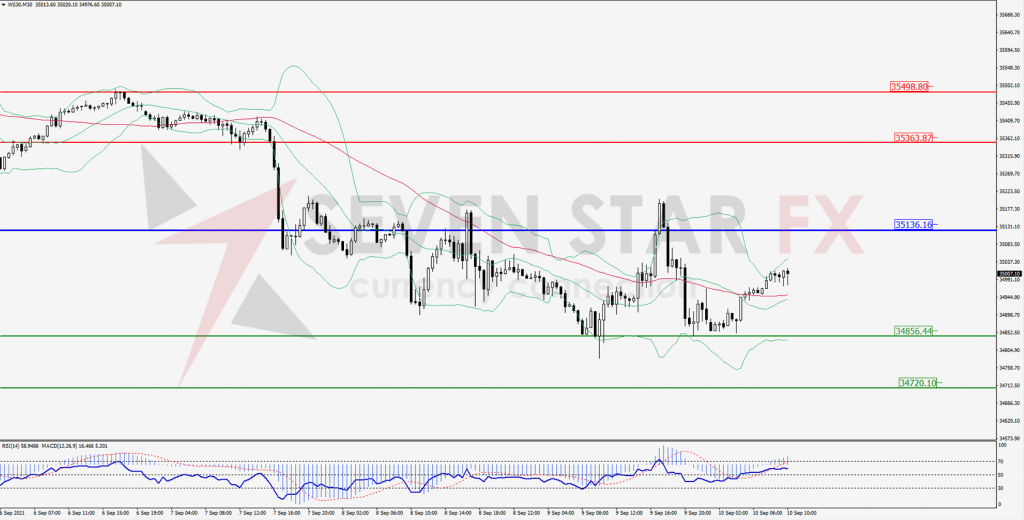
Green Lines Indicate Resistance Levels – Red Lines Indicates Support Levels
Light Blue is a Pivot Point – Black represents the price when the report was produced