Market Wrap: Stocks, Bonds, Commodities
US stocks ended a choppy session lower on Monday as investors grew nervous ahead of the third-quarter earnings reporting season.
The Dow Jones Industrial Average fell 250.19 points (0.72%) to 34,496.06, the S&P 500 lost 30.15 points (0.69%) to 4,361.19 and the Nasdaq Composite dropped 93.34 points (0.64%) to 14,486.20.
Asian shares dropped and the safe-haven dollar held firm on Tuesday, as a global energy crunch fuelled inflation fears, clouding investor sentiment before the U.S. corporate earnings season.
MSCI’s index of Asia-Pacific stocks outside Japan is down 1.32% to 796.21 levels. Australian index fell 0.26% to 7,280.70. Japanese Nikkei Index lost 0.94% to 28,230.61.
European stocks were lower on Tuesday, with the Stoxx Europe 50 Index fell 0.91% to 4,035.45, Germany’s DAX lost 0.86% to 15,069.10, and France’s CAC slipped 0.89% to 6,512.02, and U.K.’s FTSE 100 lost 0.88% to 7,083.96.
Benchmark 10-year U.S. Treasury rose as demand for safe assets grows again, today 10-year bond yields rose 0.10% to 1.607.
Oil prices fell for the first time in four days on Tuesday, taking a breather, analysts said, after weeks of gains fuelled by a rebound in global demand that is contributing to energy shortages in economies from Europe to Asia.
Spot Brent crude oil gained 0.24% to $83.85 per barrel. US West Texas Intermediate crude rose 0.15% to $80.64 a barrel.
The yellow metal traded 0.35% higher to 1761.80 dollars per ounce.
Market Wrap: Forex
The dollar rose on Monday as surging energy prices prompted investors to seek safe havens, with the greenback hitting a nearly three-year high against the yen on expectations the U.S. Federal Reserve will announce a tapering of its bond purchases next month.
Today, the U.S. dollar index measures the greenback against a trade-weighted basket of six major currencies, which fell 0.05% to 94.270.
The Euro US Dollar (EUR/USD) is a widely traded pair that is rose 0.13% today. This left the pairing trading around $1.15650.
The Japanese yen fell against the U.S. dollar on Tuesday as the stock pushes higher. Today US/JPY fell 0.15% to 113.120 level.
Another commodity-related currency mixed against the U.S dollar, AUD/USD down 0.05% to 0.73460, and NZD/USD flat to 0.69420 level.
EUR/USD Intraday: Support at 1.15562
Our pivot point is at 1.15562
Preferable Price Action: Take long positions above pivot level with targets at 1.15878 & 1.16043 in extension.
Alternative Price Action: Below pivot looks for a further downside to 1.15233 & 1.15065.
Comment: Pair above its 55MA & 20MA and RSI above 50 levels.
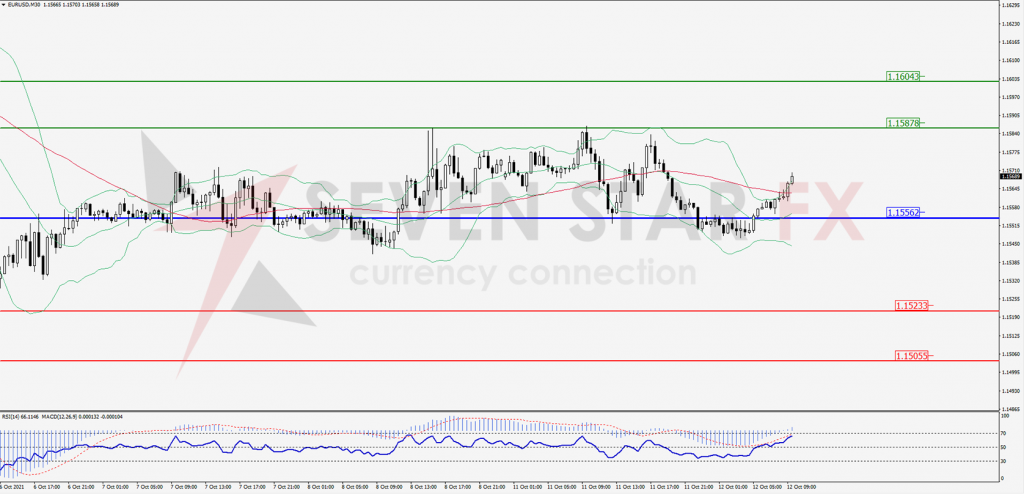
Green Lines Indicate Resistance Levels – Red Lines Indicates Support Levels
Light Blue is a Pivot Point – Black represents the price when the report was produced
GBP/USD Intraday: In a consolidation zone
Our pivot point is at 1.35857
Preferable Price Action: Buy positions above pivot with targets at 1.36713 & 1.36159 in extension.
Alternative Price Action: The price below pivot would call for further downside to 1.35096 & 1.34614.
Comment: Pair above its 20MA and RSI above 50 levels.
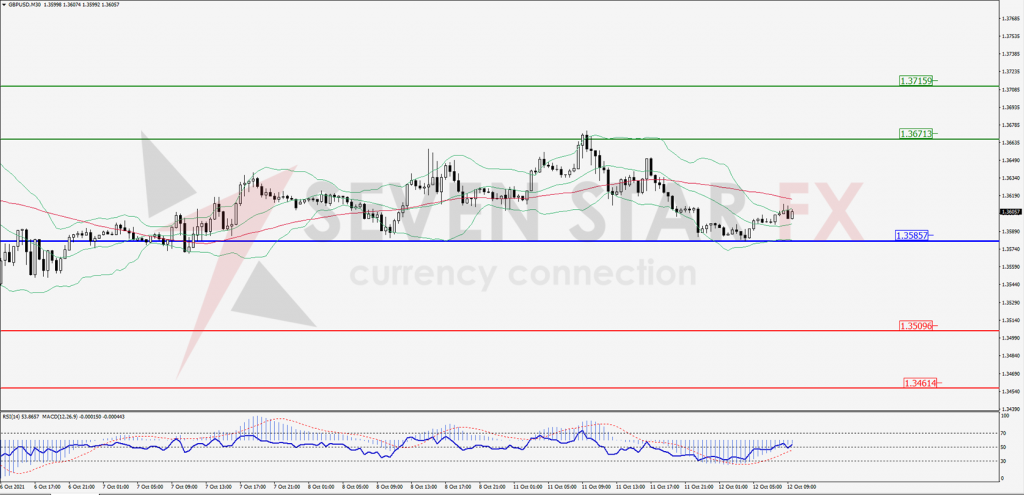
Green Lines Indicate Resistance Levels – Red Lines Indicates Support Levels
Light Blue is a Pivot Point – Black represents the price when the report was produced
USD/JPY Intraday: Resistance level at 111.494
Our pivot point is at 111.494
Preferable Price Action: Sell position below pivot with the target at 112.579 and 111.944 in extension.
Alternative Price Action: The upside breakout of the pivot would call for 114.393 and 115.005
Comment: Price below its 55MA & 20MA and MACD in negative territory.
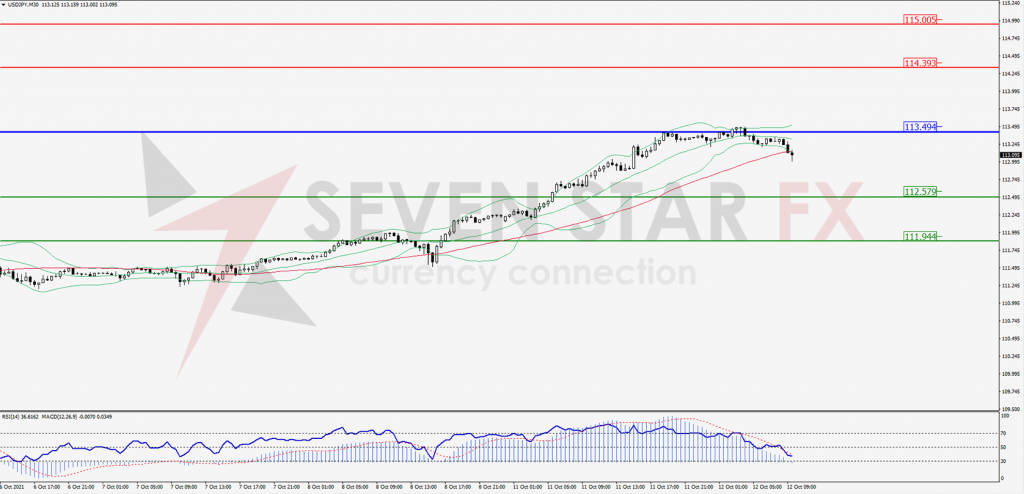
Green Lines Indicate Resistance Levels – Red Lines Indicates Support Levels
Light Blue is a Pivot Point – Black represents the price when the report was produced
AUD/USD Intraday: Break Resistance level
Our pivot point is at 0.73172
Preferable Price Action: Buy Positions above pivot with targets at 0.73740 & 0.73973 in extension.
Alternative Price Action: Below pivot looks for a further downside with 0.72637 & 0.72374 as targets.
Comment: Pair above its 55MA & 20MA and RSI above 50 levels.
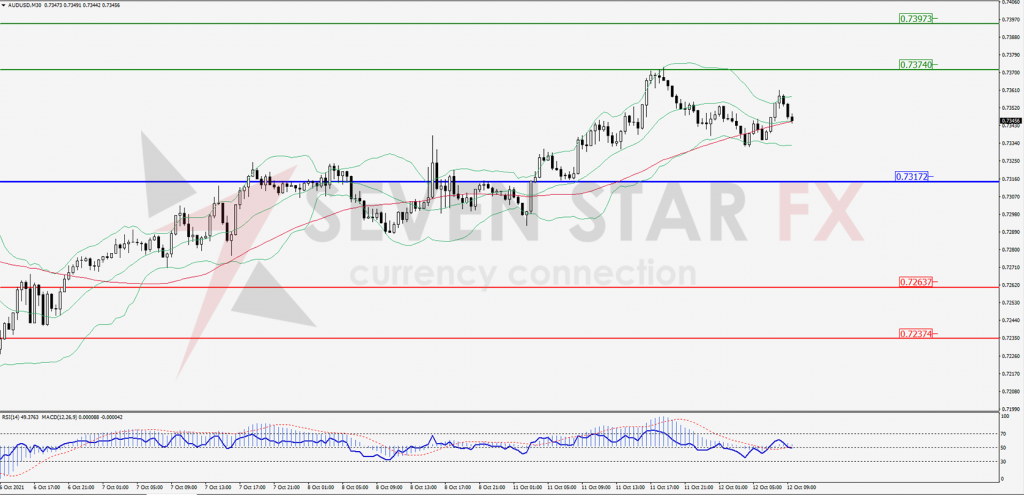
Green Lines Indicate Resistance Levels – Red Lines Indicates Support Levels
Light Blue is a Pivot Point – Black represents the price when the report was produced
CRUDEOIL Intraday: Resistance at 80.80
Our pivot point is at 80.80
Preferable Price Action: Below pivots sell Oil with 78.15 & 76.78 as targets.
Alternative Price Action: Buy crude above pivot with targets at 82.92 and 84.12 in extension.
Comment: Crude is below its 55MA and MACD in the negative territory.
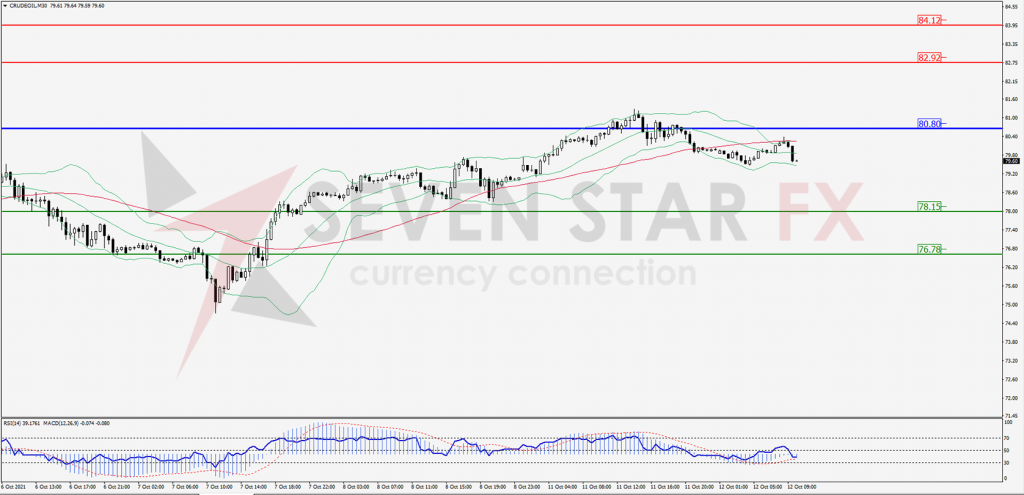
Green Lines Indicate Resistance Levels – Red Lines Indicates Support Levels
Light Blue is a Pivot Point – Black represents the price when the report was produced
XAU/USD Intraday: In a consolidation zone
Our pivot point is 1756.36
Preferable Price Action: Further upside to 1771.44 and 1779.33.
Alternative Price Action: If the price gives a downside breakout of a pivot, then the price extends to 1740.78 and 1732.09.
Comment: MACD in positive territory and price above its 20MA & 55MA.
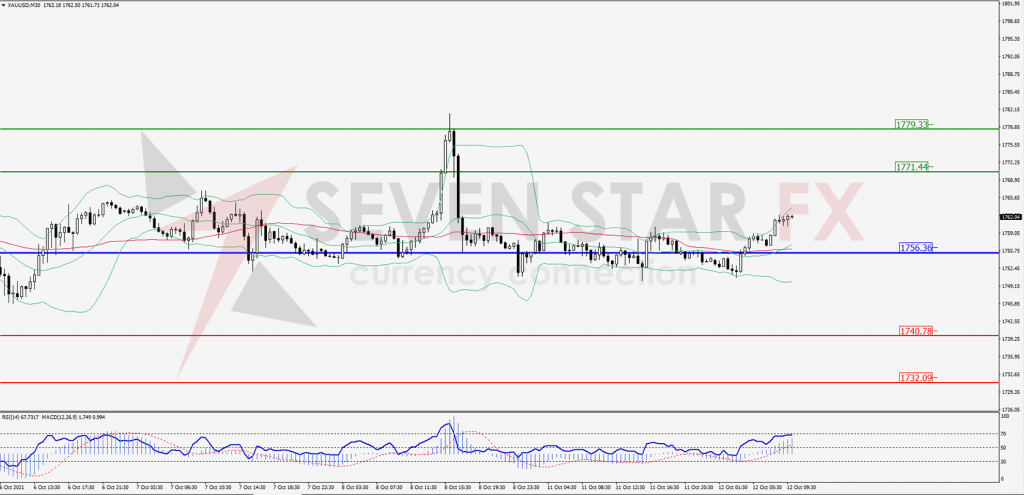
Green Lines Indicate Resistance Levels – Red Lines Indicates Support Levels
Light Blue is a Pivot Point – Black represents the price when the report was produced
Dow Jones Intraday: Break support level
Our pivot point is 34,544.00
Preferable Price Action: Take short positions below pivot with targets at 34,038.00 & 33,827.00.
Alternative Price Action: below 34,544.00 looks for further downside to 34,038.00 & 33,827.00.
Comment: Price below its 55MA & 20MA and RSI below 50 levels.
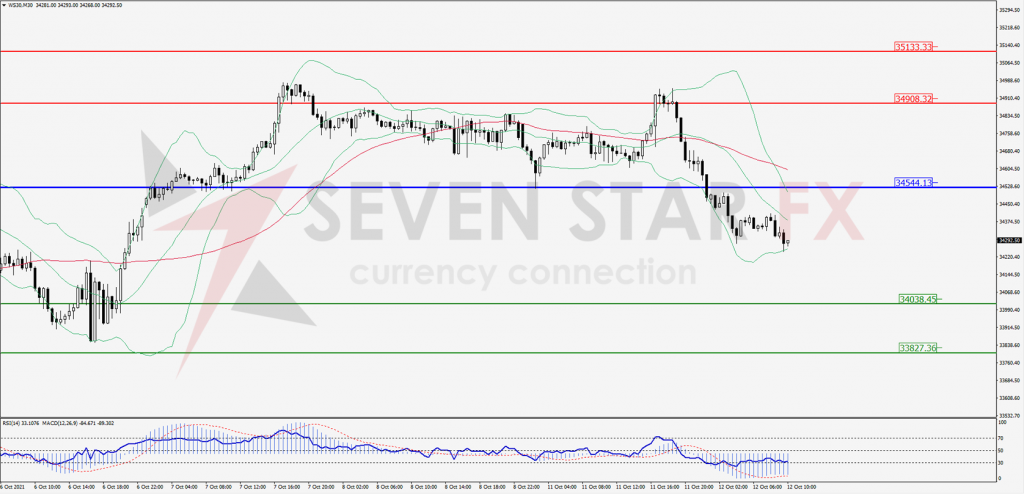
Green Lines Indicate Resistance Levels – Red Lines Indicates Support Levels
Light Blue is a Pivot Point – Black represents the price when the report was produced