Market Wrap: Stocks, Bonds, Commodities
Most Asian currencies inched higher on Thursday as U.S. inflation data cemented bets for a Federal Reserve interest rate cut next week, while focus was on China’s annual policy meeting for clues on fresh stimulus measures.
The Dow Jones Industrial Average fail 99.27 points to 44,148.56, the S&P 500 gain 0.82% to 6,084.19 and the Nasdaq Composite up 347.65 points to 20,034.89.
MSCI’s index of Asia-Pacific stocks outside Japan is up 0.39% to 728.10 levels. The Australian index was lower by 0.28% to 8,330.30. Japanese Nikkei Index increase 1.27% today.
European stocks were positive on Thursday, with the Stoxx Europe 50 Index increase 0.16% to 4,959.55 Germany’s DAX ascend 0.34% to 20,399.16, and France’s CAC higher 0.39% to 7,423.40 and U.K.’s FTSE 100 gain 0.26% to 8,301.62.
Benchmark 10-year U.S. Treasury rose as demand for safe assets slipped again, today 10-year bond yields 0.33% to 4.2880.
Oil prices were little changed in Asian trade on Thursday as forecasts of weak demand and a higher-than-expected rise in U.S. gasoline and distillate inventories stemmed gains from an additional round of EU sanctions threatening Russian oil flows.
Spot Brent crude oil increase 0.23% to $73.69 per barrel. US West Texas Intermediate crude is increase 0.13% to $70.38 a barrel.
The yellow metal gold is down 0.17% to 2,751.90 dollars per ounce.
Market Wrap: Forex
The Australian dollar rose sharply on Thursday, rebounding from a one-year low after stronger-than-expected labor data raised doubts over the potential timing of interest rate cuts by the Reserve Bank of Australia.
Today, the U.S. dollar index measures the Greenback against a trade-weighted basket of six major currencies, which either descend 0.25% to 106.130.
The Euro US Dollar (EUR/USD) is a widely traded is up 0.27% today. This left the pair trading around $1.05220.
The Japanese yen was will move negative against the U.S. dollar on Thursday. Today USD/JPY is trades pair that decrease 0.02% to the 152.42 level.
Another commodity-related currency positive against the U.S dollar, AUD/USD gain 0.89% to 0.64240, and NZD/USD increase 0.50% to 0.58130 level.
EUR/USD Intraday: Trend on the upside
Our pivot point is at 1.05040
Preferable Price Action: Take buy positions above pivot level with targets at 1.05220 & 1.05380 in extension.
Alternative Price Action: Sell pivot looks for a further downside to 1.04860 & 1.04710.
Comment: RSI is above 50 levels and pairs above its 20MA.
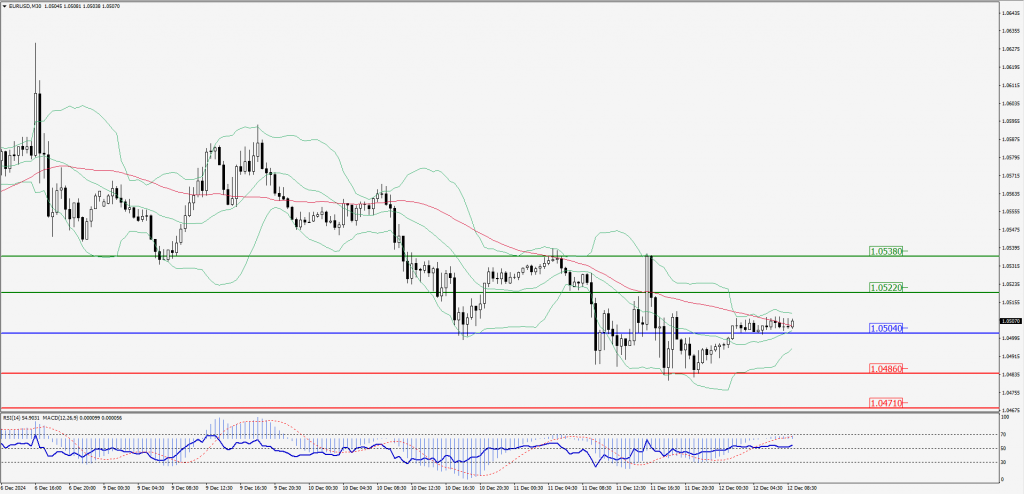
Green Lines Indicate Resistance Levels – Red Lines Indicate Support Levels
Light Blue is a Pivot Point – Black represents the price when the report was produced
GBP/USD Intraday: Trend on the upside
Our pivot point is at 1.27620
Preferable Price Action: Buy positions above pivot with targets at 1.27750 & 1.27860 in extension.
Alternative Price Action: The price below pivot would call for further downside to 1.27500 & 1.27390.
Comment: RSI is above 50 levels and pairs above its 20MA & 55MA.
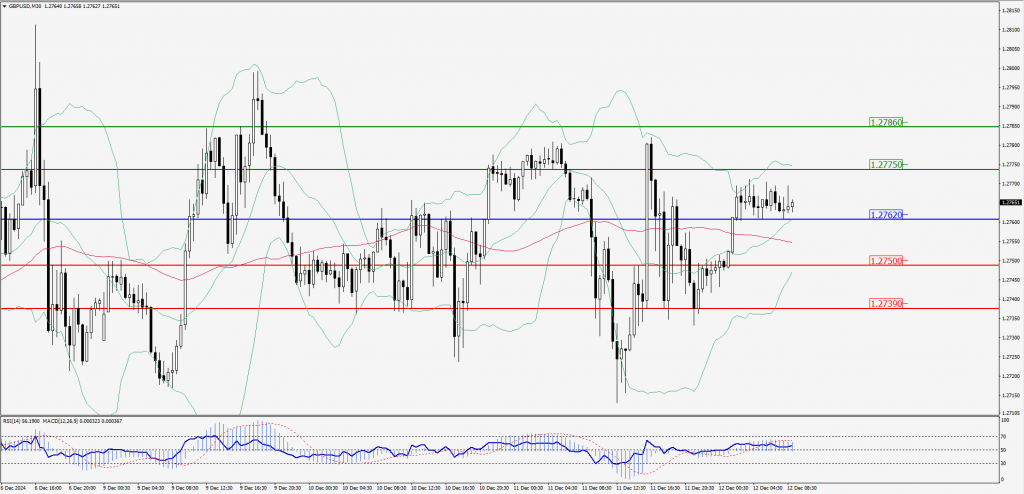
Green Lines Indicate Resistance Levels – Red Lines Indicate Support Levels
Light Blue is a Pivot Point – Black represents the price when the report was produced
USD/JPY Intraday: Trend on the upside
Our pivot point is at 152.560
Preferable Price Action: Buy position above pivot with the target at 153.070 and 153.480 in extension.
Alternative Price Action: The downside breakout of the pivot would call for 152.040 and 151.560.
Comment: MACD is above 50 levels and pairs above its 55MA & 20MA.
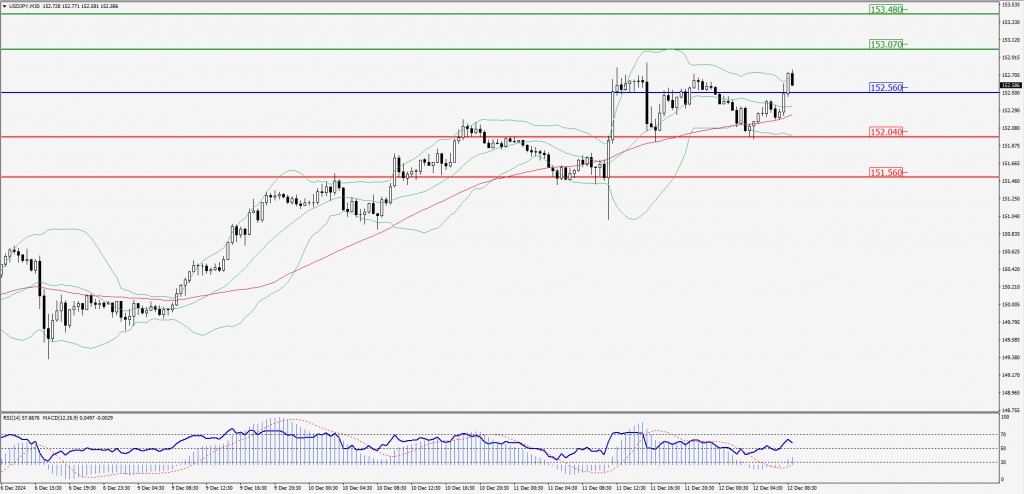
Green Lines Indicate Resistance Levels – Red Lines Indicate Support Levels
Light Blue is a Pivot Point – Black represents the price when the report was produced
AUD/USD Intraday: Major trend on the upside
Our pivot point is at 0.64160
Preferable Price Action: Buy positions above pivot with targets at 0.64330 & 0.64480 in extension.
Alternative Price Action: Below pivot a further downside with 0.63990 & 0.63830 as targets.
Comment: RSI is above 50 levels and pairs above its 55MA & 20MA.
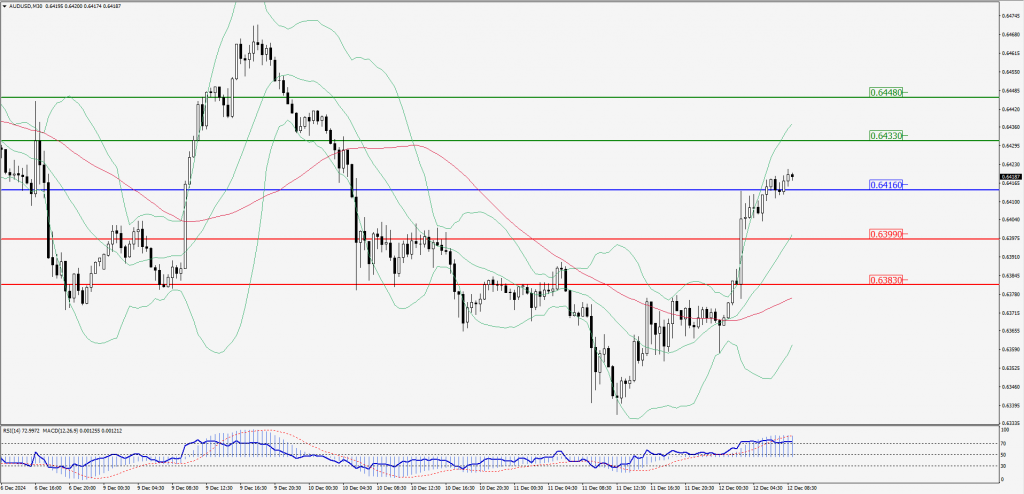
Green Lines Indicate Resistance Levels – Red Lines Indicate Support Levels
Light Blue is a Pivot Point – Black represents the price when the report was produced
CRUDEOIL Intraday: Trend on the upside
Our pivot point is at 69.98
Preferable Price Action: Above pivot buy oil with 70.42 & 70.81 as targets.
Alternative Price Action: Sell crude below pivot with targets at 69.53 & 69.16 in extension.
Comment: RSI is at above 50 levels and pairs above its 55MA & 20MA.
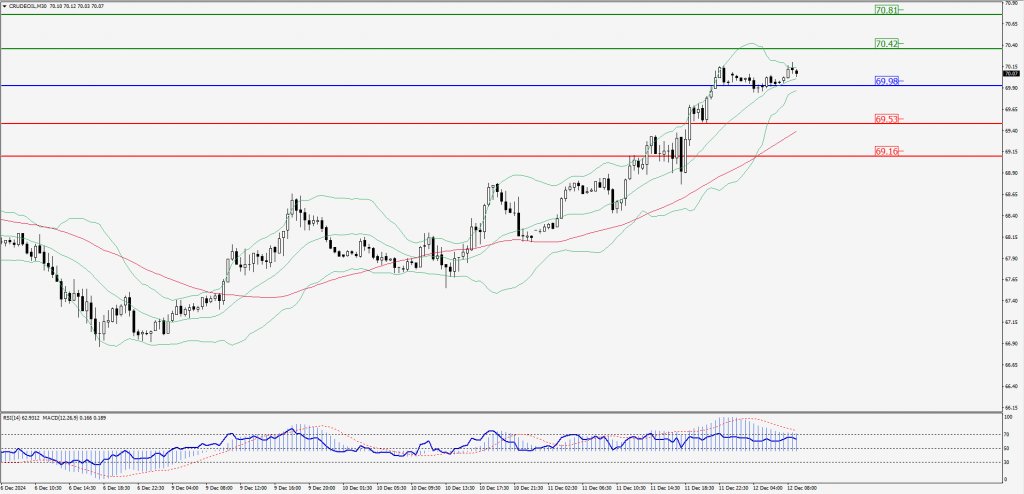
Green Lines Indicate Resistance Levels – Red Lines Indicate Support Levels
Light Blue is a Pivot Point – Black represents the price when the report was produced
XAU/USD Intraday: Trend on the upside
Our pivot point is at 2712.70
Preferable Price Action: Further upside to 2725.60 and 2736.80.
Alternative Price Action: If the price gives an downside breakout of a pivot, then the price extends to 2700.10 and 2688.20.
Comment: MACD is above 50 levels and pairs above its 55MA.
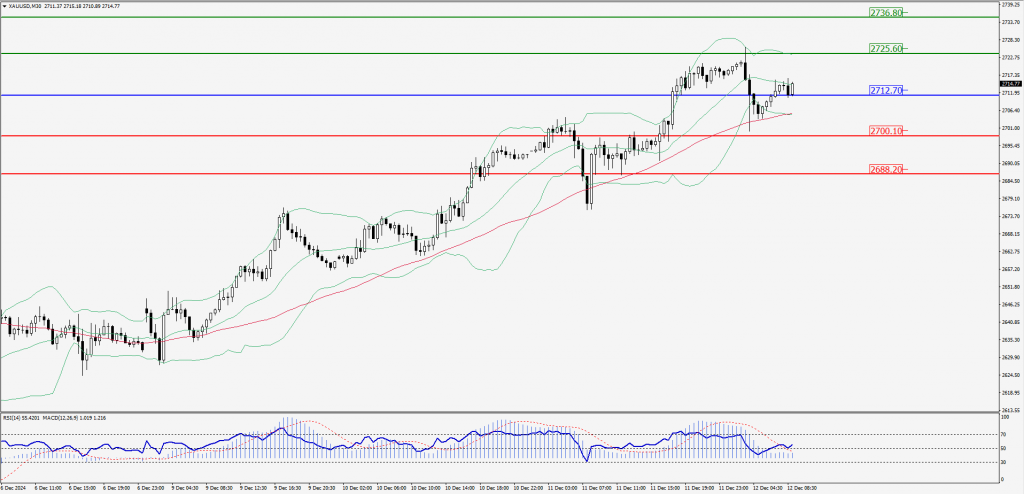
Green Lines Indicate Resistance Levels – Red Lines Indicate Support Levels
Light Blue is a Pivot Point – Black represents the price when the report was produced
Dow Jones Intraday: Trend on the downside
Our pivot point is 44,114.20
Preferable Price Action: Take sell positions below the pivot with targets at 43,947.40 & 43,795.50.
Alternative Price Action: Above 44,114.20 looks for further upside to 44,282.90 & 44,430.90.
Comment: RSI is below 50 levels and pairs below its 55MA & 20MA.
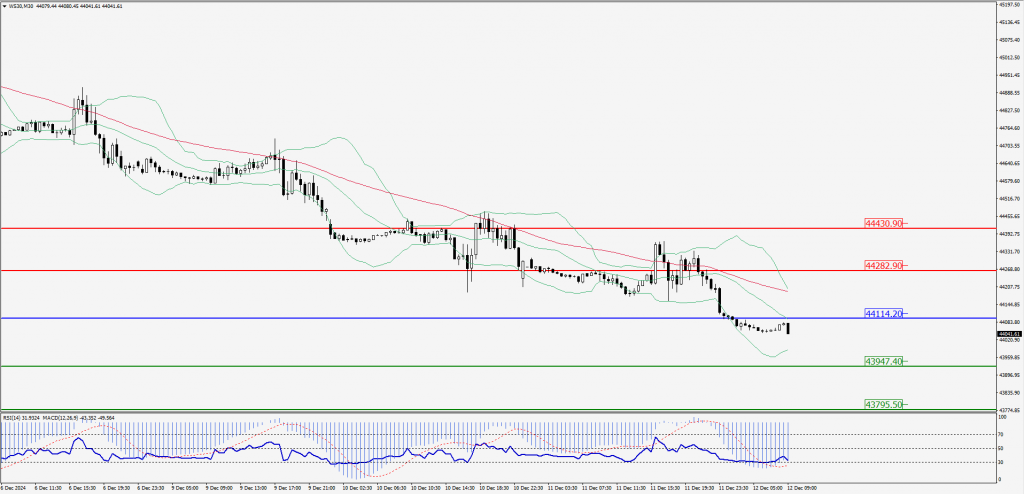
Green Lines Indicate Resistance Levels – Red Lines Indicate Support Levels
Light Blue is a Pivot Point – Black represents the price when the report was produced