Market Wrap: Stocks, Bonds, Commodities
Wall Street advanced on Friday and the S&P 500 notched an all-time closing high as market participants digested an inflation reading that was in line with consensus, but also marked the largest annual increase in consumer prices in nearly four decades.
The Dow Jones Industrial Average rose 216.3 points (0.60%) to 35,970.99, the S&P 500 gained 44.57 points (0.95%) to 4,712.02 and the Nasdaq Composite added 113.23 points (0.73%) to 15,630.60.
MSCI’s index of Asia-Pacific stocks outside Japan slipped 0.16% to 795.36 levels. Australian index rose 0.35% to 7,379.30. Japanese Nikkei Index advances 0.71% to 28,640.49.
European stocks were higher on Monday, with the Stoxx Europe 50 Index rose 0.05% to 4,188.25, Germany’s DAX gained 0.26% to 15,665.30, and France’s CAC advance 0.06% to 6,994.885, and U.K.’s FTSE 100 flat to 7,293.30.
Benchmark 10-year U.S. Treasury rose as demand for safe assets grows again, today 10-year bond yields flat to 1.511.
Oil prices rose on Monday, extending gains from last Friday, helped by growing optimism that the Omicron coronavirus variant’s impact will be limited on global economic growth and fuel demand.
Spot Brent crude oil rose 0.84% to $75.77 per barrel. US West Texas Intermediate crude gained 1.12% to $72.44 a barrel.
The yellow metal gold is gained 0.10% to 1786.60 dollars per ounce.
Market Wrap: Forex
The dollar was quiet at the start of a week in which central bank meetings, including by the Federal Reserve, will likely drive currency markets, while sterling fell slightly after Boris Johnson warned about the impact of the new COVID-19 variant.
Today, the U.S. dollar index measures the greenback against a trade-weighted basket of six major currencies, which rose 0.18% to 96.250.
The Euro US Dollar (EUR/USD) is a widely traded pair that is falling 0.21% today. This left the pairing trading around $1.12880.
The Japanese yen fell against the U.S. dollar on Monday as the stock pushes higher. Today US/JPY is rose 0.15% to 113.550 level.
Another commodity-related currency lower against the U.S dollar, AUD/USD lost 0.32% to 0.71460, and NZD/USD declined 0.23% to 0.67780 level.
EUR/USD Intraday: Resistance at 1.13150
Our pivot point is at 1.13150
Preferable Price Action: Take Short positions Below pivot level with targets at 1.12723 & 1.12472 in extension.
Alternative Price Action: Above pivot looks for a further Upside to 1.13569 & 1.13743.
Comment: Pair below its 20MA and RSI below 50 levels.
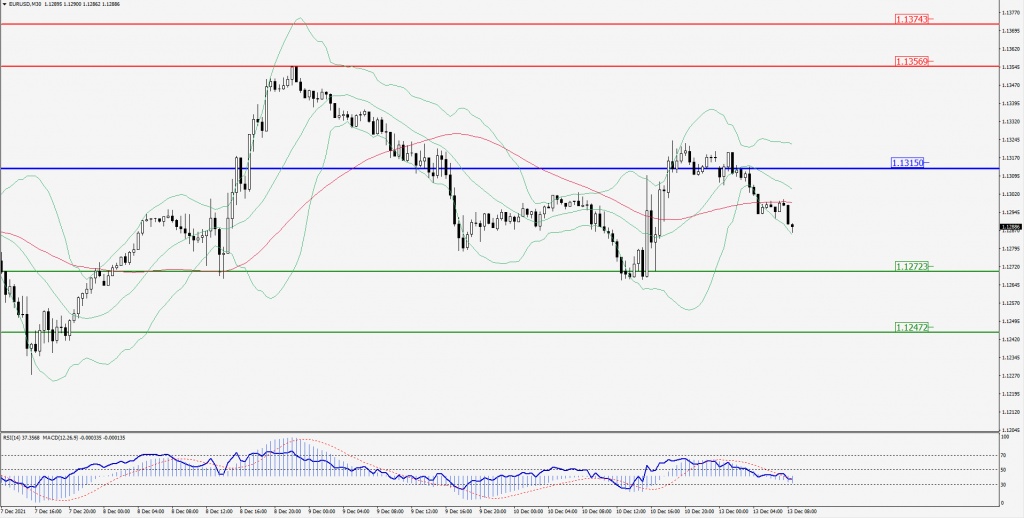
Green Lines Indicate Resistance Levels – Red Lines Indicates Support Levels
Light Blue is a Pivot Point – Black represents the price when the report was produced
GBP/USD Intraday: Resistance at 1.32612
Our pivot point is at 1.32612
Preferable Price Action: Sell positions below pivot with targets at 1.32080 & 1.31827 in extension.
Alternative Price Action: The price above pivot would call for further upside to 1.33078 & 1.33319.
Comment: Pair below its 20MA and RSI at 50 levels.
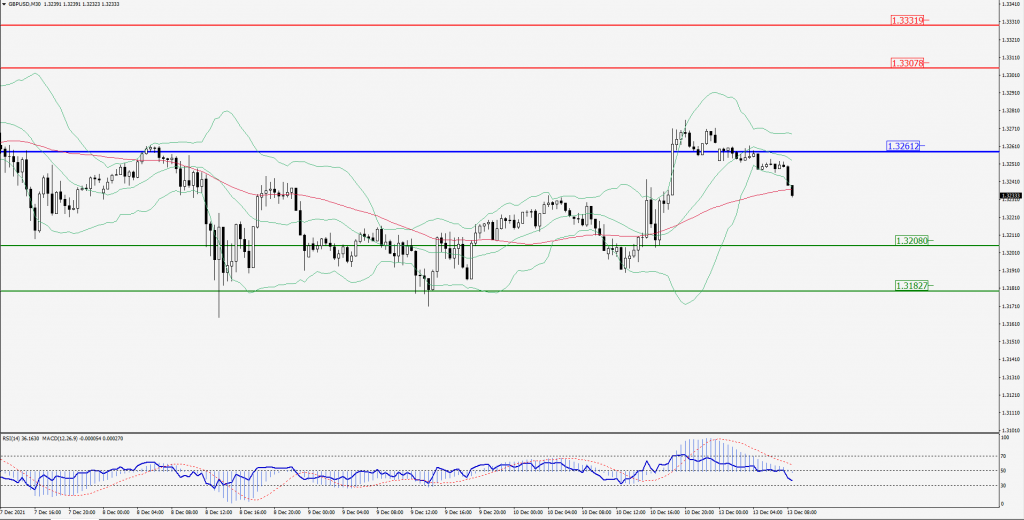
Green Lines Indicate Resistance Levels – Red Lines Indicates Support Levels
Light Blue is a Pivot Point – Black represents the price when the report was produced
USD/JPY Intraday: In a consolidation area
Our pivot point is at 113.338
Preferable Price Action: Buy position Above pivot with the target at 113.849 and 114.161 in extension.
Alternative Price Action: The Downside breakout of the pivot would call for 112.837 and 112.508.
Comment: Price above its 20MA and MACD in positive territory.
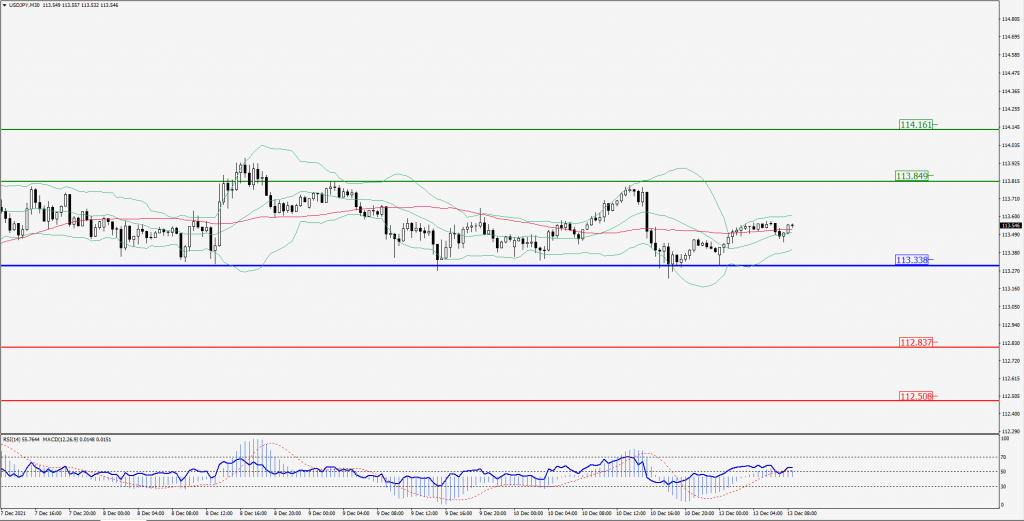
Green Lines Indicate Resistance Levels – Red Lines Indicates Support Levels
Light Blue is a Pivot Point – Black represents the price when the report was produced
AUD/USD Intraday: Strong trend on the upside
Our pivot point is at 0.71506
Preferable Price Action: Buy Positions above pivot with targets at 0.71949 & 0.72148 in extension.
Alternative Price Action: Below pivot looks for a further downside with 0.71101 & 0.70891 as targets.
Comment: Pair above its 55MA & 20MA and RSI above 50 levels.
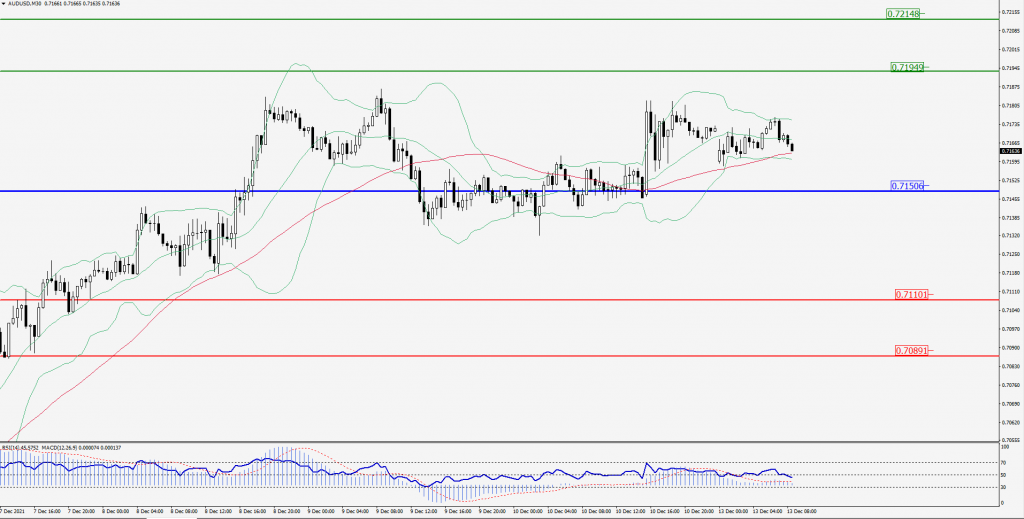
Green Lines Indicate Resistance Levels – Red Lines Indicates Support Levels
Light Blue is a Pivot Point – Black represents the price when the report was produced
CRUDEOIL Intraday: Trend on the upside
Our pivot point is at 71.59
Preferable Price Action: Above pivots Buy Oil with 73.83 & 74.88 as targets.
Alternative Price Action: Sell crude Below pivot with targets at 69.54 and 68.48 in extension.
Comment: Crude is above its 20MA & 55MA and MACD in the positive territory.
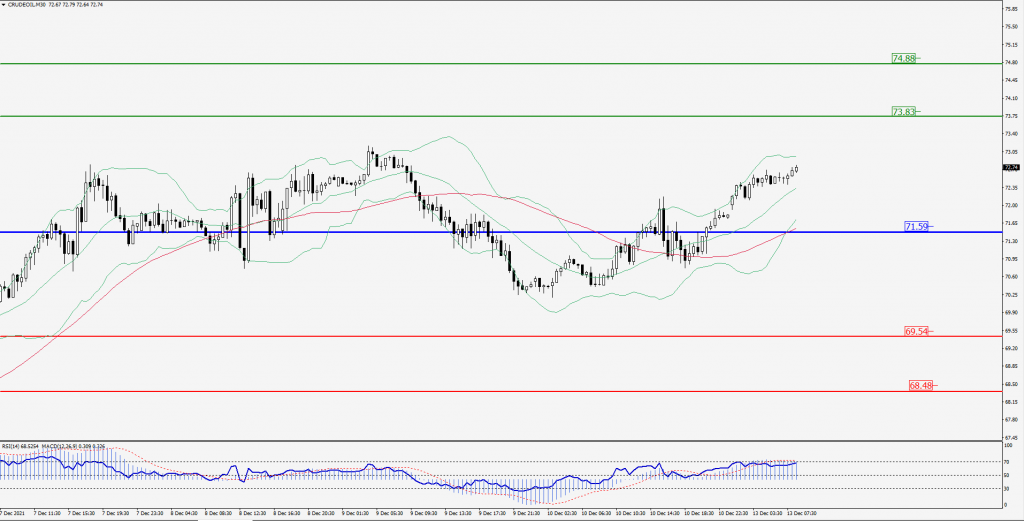
Green Lines Indicate Resistance Levels – Red Lines Indicates Support Levels
Light Blue is a Pivot Point – Black represents the price when the report was produced
XAU/USD Intraday: Support at 1781.31
Our pivot point is 1781.31
Preferable Price Action: Further upside to 1788.75 and 1792.72.
Alternative Price Action: If the price gives an upside breakout of a pivot, then the price extends to 1774.30 and 1770.60.
Comment: MACD in positive territory and price above its 20MA & 55MA.
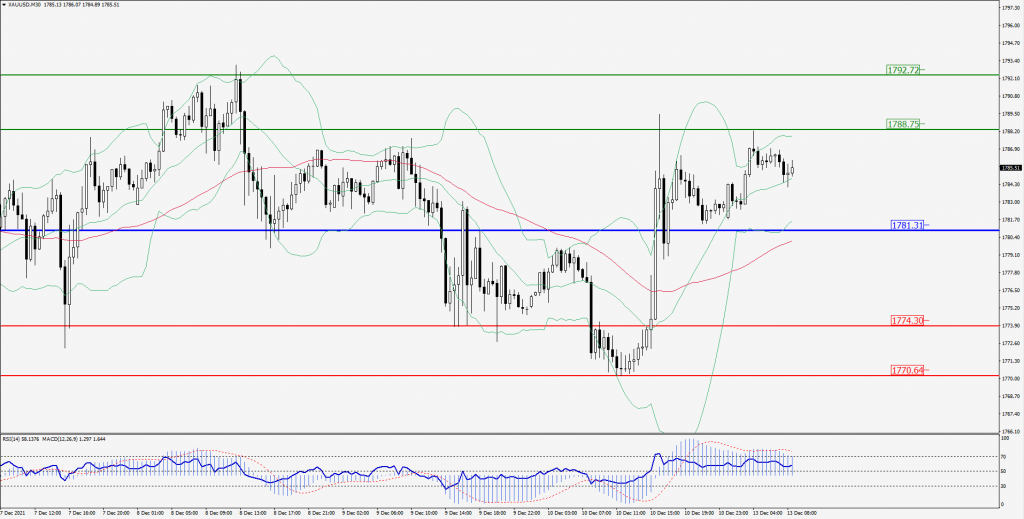
Green Lines Indicate Resistance Levels – Red Lines Indicates Support Levels
Light Blue is a Pivot Point – Black represents the price when the report was produced
Dow Jones Intraday: Trend on the upside
Our pivot point is 35,942.72
Preferable Price Action: Take Long positions above pivot with targets at 36,265.74 & 36,436.98.
Alternative Price Action: Below 35,490.00 looks for further Downside to 35,594.41 & 35,413.44.
Comment: Price above its 55MA & 20MA and RSI above 50 levels.
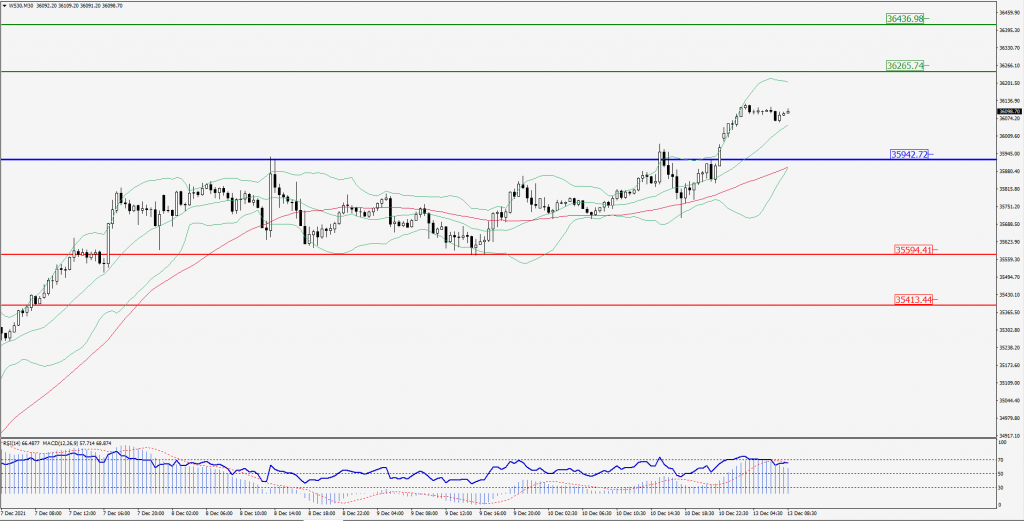
Green Lines Indicate Resistance Levels – Red Lines Indicates Support Levels
Light Blue is a Pivot Point – Black represents the price when the report was produced