Market Wrap: Stocks, Bonds, Commodities
Wall Street closed lower on Thursday as investors banked some profits after three straight days of gains and turned their focus toward upcoming inflation data and how it might influence the Federal Reserve’s meeting next week.
The Dow Jones Industrial Average fell 0.06 points to 35,754.69, the S&P 500 lost 33.76 points, or 0.72%, to 4,667.45 and the Nasdaq Composite dropped 269.62 points, or 1.71%, to 15,517.37.
MSCI’s index of Asia-Pacific stocks outside Japan slipped 0.90% to 796.34 levels. Australian index slipped 0.42% to 7,353.50. Japanese Nikkei Index fell 1.00% to 28,437.77.
European stocks were lower on Friday, with the Stoxx Europe 50 Index lost 0.44% to 4,188.25, Germany’s DAX fell 0.42% to 15,575.65, and France’s CAC down 0.48% to 6,975.88, and U.K.’s FTSE 100 slipped 0.20% to 7,306.22.
Benchmark 10-year U.S. Treasury rose as demand for safe assets grows again, today 10-year bond yields rose 1.62% to 1.511.
Oil prices settled lower on Thursday on fears about the economic outlook in the world’s biggest oil importer following rating downgrades to two Chinese property developers, and after some governments took measures to fight the Omicron variant of the coronavirus.
Spot Brent crude oil lost 0.24% to $74.24 per barrel. US West Texas Intermediate crude flat to $70.92 a barrel.
The yellow metal gold is fell 0.30% to 1771.36 dollars per ounce.
Market Wrap: Forex
The dollar was firm on Friday as traders wagered U.S. inflation figures could settle the course of interest rate rises next year, while the Chinese yuan regained its footing after being knocked back by official policy.
Today, the U.S. dollar index measures the greenback against a trade-weighted basket of six major currencies, which flat to 96.260.
The Euro US Dollar (EUR/USD) is a widely traded pair that is falling 0.20% today. This left the pairing trading around $1.13190.
The Japanese yen fell against the U.S. dollar on Friday as the stock pushes higher. Today US/JPY is rose 0.14% to 113.580 level.
Another commodity-related currency mixed against the U.S dollar, AUD/USD rose 0.05% to 0.71520, and NZD/USD declined 0.17% to 0.67810 level.
EUR/USD Intraday: Support at 1.12860
Our pivot point is at 1.12860
Preferable Price Action: Take Long positions Above pivot level with targets at 1.13330 & 1.13530 in extension.
Alternative Price Action: Below pivot looks for a further Downside to 1.12460 & 1.12260.
Comment: Pair above its 20MA and RSI above 50 levels.
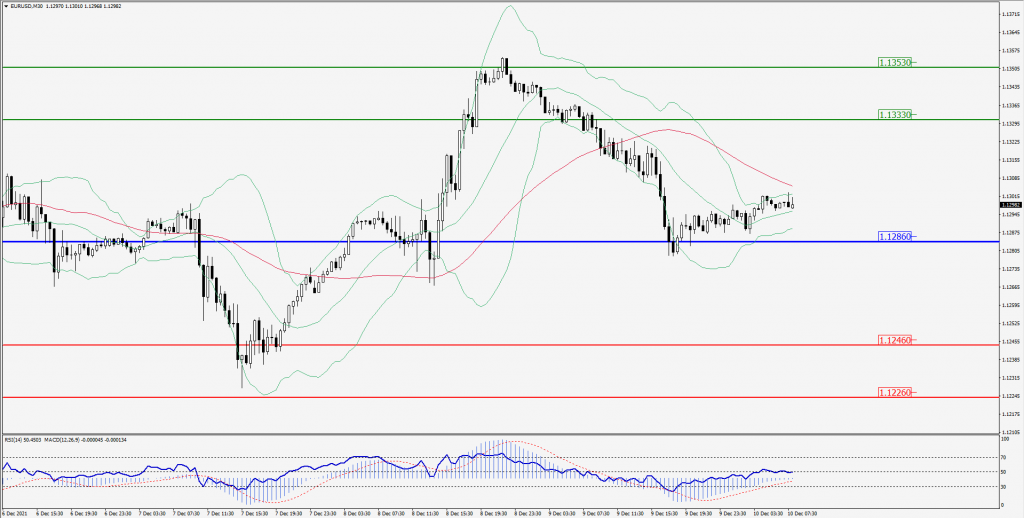
Green Lines Indicate Resistance Levels – Red Lines Indicates Support Levels
Light Blue is a Pivot Point – Black represents the price when the report was produced
GBP/USD Intraday: Resistance at 1.32390
Our pivot point is at 1.32390
Preferable Price Action: Sell positions below pivot with targets at 1.31990 & 1.31730 in extension.
Alternative Price Action: The price above pivot would call for further upside to 1.32860 & 1.33060.
Comment: Pair below its 20MA and RSI at 50 levels.
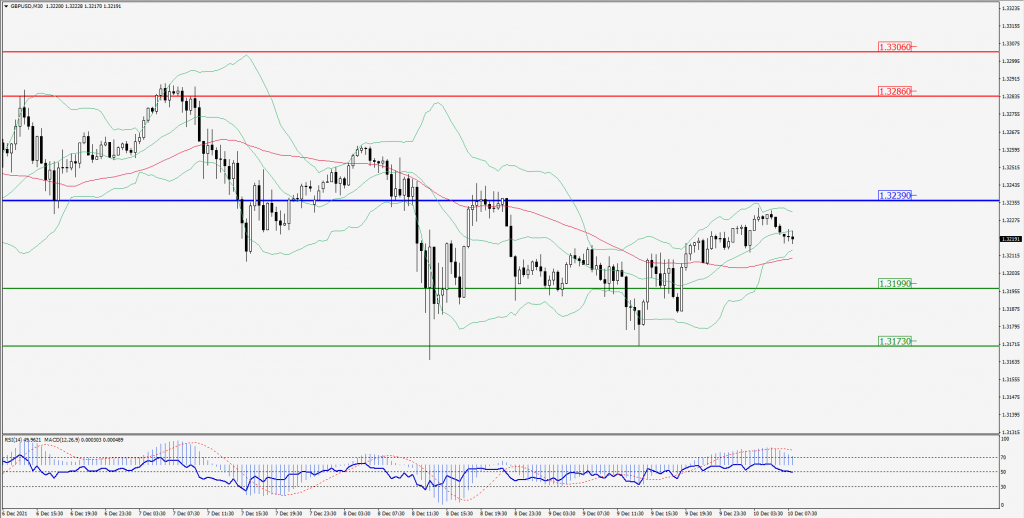
Green Lines Indicate Resistance Levels – Red Lines Indicates Support Levels
Light Blue is a Pivot Point – Black represents the price when the report was produced
USD/JPY Intraday: In a consolidation area
Our pivot point is at 113.330
Preferable Price Action: Buy position Above pivot with the target at 113.830 and 114.090 in extension.
Alternative Price Action: The Downside breakout of the pivot would call for 112.830 and 112.620.
Comment: Price above its 20MA and MACD in positive territory.
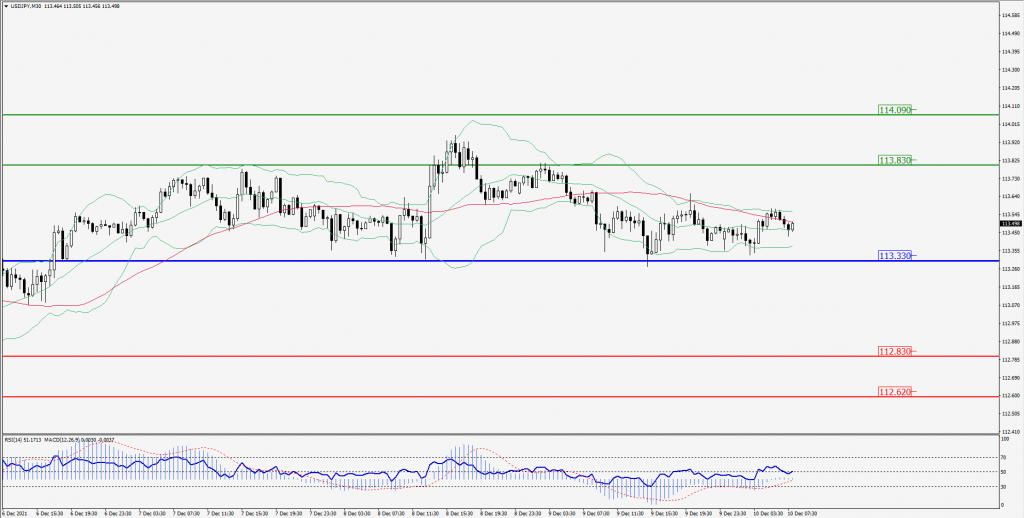
Green Lines Indicate Resistance Levels – Red Lines Indicates Support Levels
Light Blue is a Pivot Point – Black represents the price when the report was produced
AUD/USD Intraday: Strong trend on the upside
Our pivot point is at 0.71300
Preferable Price Action: Buy Positions above pivot with targets at 0.71890 & 0.72160 in extension.
Alternative Price Action: Below pivot looks for a further downside with 0.70760 & 0.70490 as targets.
Comment: Pair above its 55MA & 20MA and RSI above 50 levels.
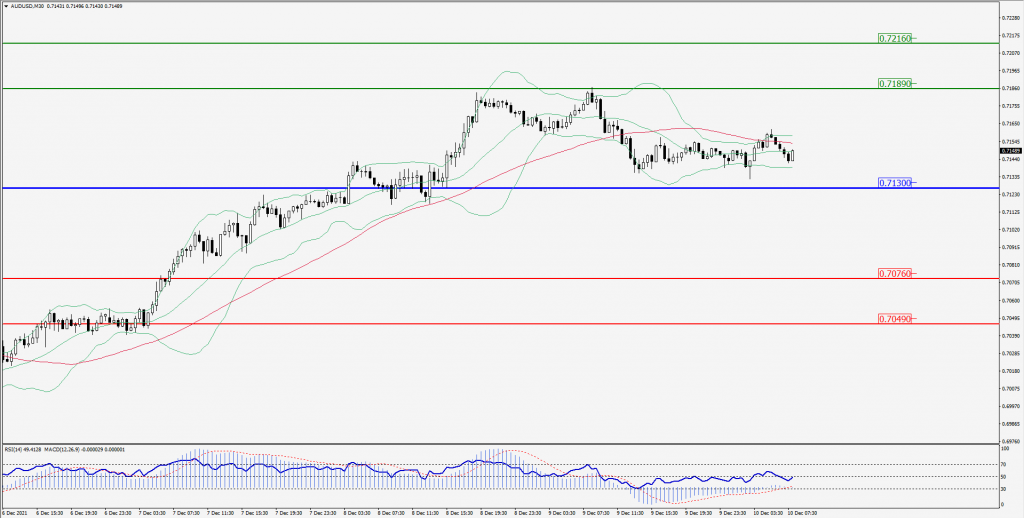
Green Lines Indicate Resistance Levels – Red Lines Indicates Support Levels
Light Blue is a Pivot Point – Black represents the price when the report was produced
CRUDEOIL Intraday: Resistance at 71.60
Our pivot point is at 71.60
Preferable Price Action: Below pivots Sell Oil with 69.60 & 68.30 as targets.
Alternative Price Action: Buy crude Above pivot with targets at 73.90 and 74.90 in extension.
Comment: Crude is below its 20MA & 55MA and MACD in the negative territory.
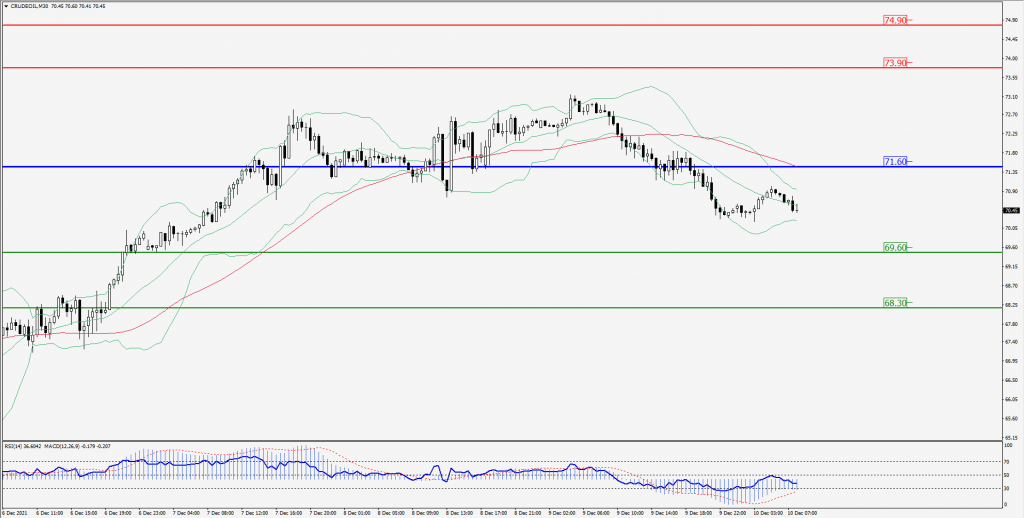
Green Lines Indicate Resistance Levels – Red Lines Indicates Support Levels
Light Blue is a Pivot Point – Black represents the price when the report was produced
XAU/USD Intraday: Resistance at 1780.30
Our pivot point is 1780.30
Preferable Price Action: Further downside to 1771.30 and 1767.30.
Alternative Price Action: If the price gives an upside breakout of a pivot, then the price extends to 1787.90 and 1792.30.
Comment: MACD in negative territory and price below its 20MA & 55MA.
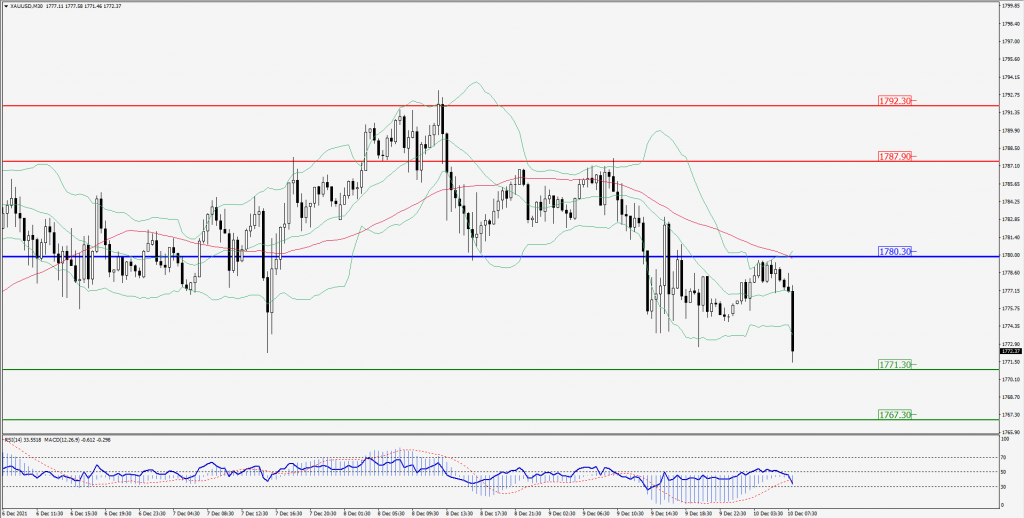
Green Lines Indicate Resistance Levels – Red Lines Indicates Support Levels
Light Blue is a Pivot Point – Black represents the price when the report was produced
Dow Jones Intraday: Trend on the upside
Our pivot point is 35,530.00
Preferable Price Action: Take Long positions above pivot with targets at 35,960.00 & 36,160.00.
Alternative Price Action: Below 35,490.00 looks for further Downside to 35,130.00 & 34,900.00.
Comment: Price above its 55MA & 20MA and RSI above 50 levels.
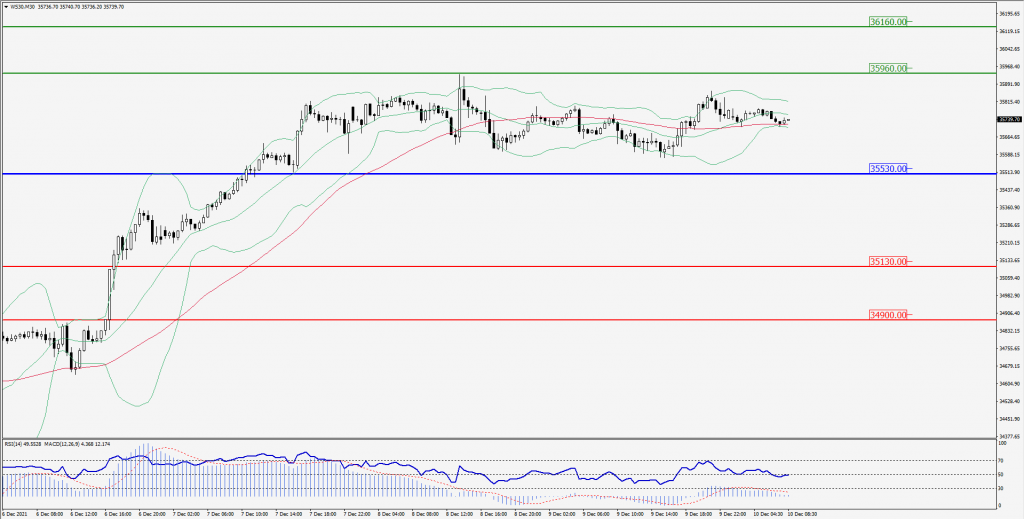
Green Lines Indicate Resistance Levels – Red Lines Indicates Support Levels
Light Blue is a Pivot Point – Black represents the price when the report was produced