Market Wrap: Stocks, Bonds, Commodities
Most Asian currencies moved little on Tuesday as the dollar tread water in anticipation of key inflation data due later in the day, while the Japanese yen weakened further ahead of more cues on the economy.
The Dow Jones Industrial Average fell 140.53 points to 39,357.01, the S&P 500 gain 0.02% to 5,344.39 and the Nasdaq Composite ascend 35.51 points to 16,780.61.
MSCI’s index of Asia-Pacific stocks outside Japan is up 0.25% to 683.11 levels. The Australian index was higher by 0.17% to 7,826.80. Japanese Nikkei Index increase 3.37% today.
European stocks were positive on Tuesday, with the Stoxx Europe 50 Index increase 0.43% to 4,691.95, Germany’s DAX ascend 0.43% to 17,787.95, and France’s CAC higher 0.29% to 7,271.97 and U.K.’s FTSE 100 gain 0.21% to 8,227.84.
Benchmark 10-year U.S. Treasury rose as demand for safe assets slipped again, today 10-year bond yields increase 0.15% to 3.9160.
Oil prices edged lower on Tuesday, breaking a five-day streak of gains, as markets refocused on concerns about demand after OPEC on Monday cut its forecast for demand growth in 2024 due to softer expectations in China.
Spot Brent crude oil decrease 0.56% to $81.84 per barrel. US West Texas Intermediate crude is decrease 0.52% to $79.64 a barrel.
The yellow metal gold is up 0.01% to 2,504.20 dollars per ounce.
Market Wrap: Forex
The dollar was in limbo on Tuesday as investors waited to see how U.S. economic data affected the chance of outsized rate cuts, while a rally in Japanese stocks helped staunch the bleeding in yen carry trades.
Today, the U.S. dollar index measures the Greenback against a trade-weighted basket of six major currencies, which increase 0.02% to 102.985.
The Euro US Dollar (EUR/USD) is a widely traded pair that is either up or down 0.02% today. This left the pair trading around $1.09310.
The Japanese yen was will move positive against the U.S. dollar on Tuesday. Today USD/JPY is trades pair that increase 0.44% to the 147.84 level.
Another commodity-related currency positive against the U.S dollar, AUD/USD gain 0.25% to 0.66020, and NZD/USD increase 0.36% to 0.60380 level.
EUR/USD Intraday: In consolidation state at 1.09310
Our pivot point is at 1.09310
Preferable Price Action: Take buy positions above pivot level with targets at 1.09390 & 1.09460 in extension.
Alternative Price Action: Sell pivot looks for a further downside to 1.09160 & 1.09230.
Comment: RSI is at 50 levels and Pairs above its 20MA.
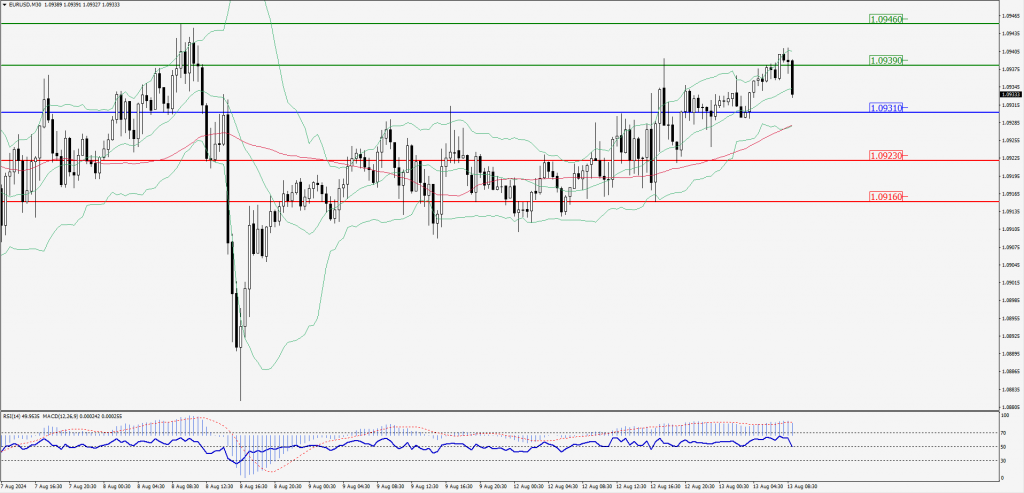
Green Lines Indicate Resistance Levels – Red Lines Indicate Support Levels
Light Blue is a Pivot Point – Black represents the price when the report was produced
GBP/USD Intraday: Major trend on the upside
Our pivot point is at 1.27940
Preferable Price Action: Buy positions above pivot with targets at 1.28130 & 1.28290 in extension.
Alternative Price Action: The price below pivot would call for further downside to 1.27760 & 1.27600.
Comment: RSI is above 50 levels and Pairs above its 20MA & 55MA.
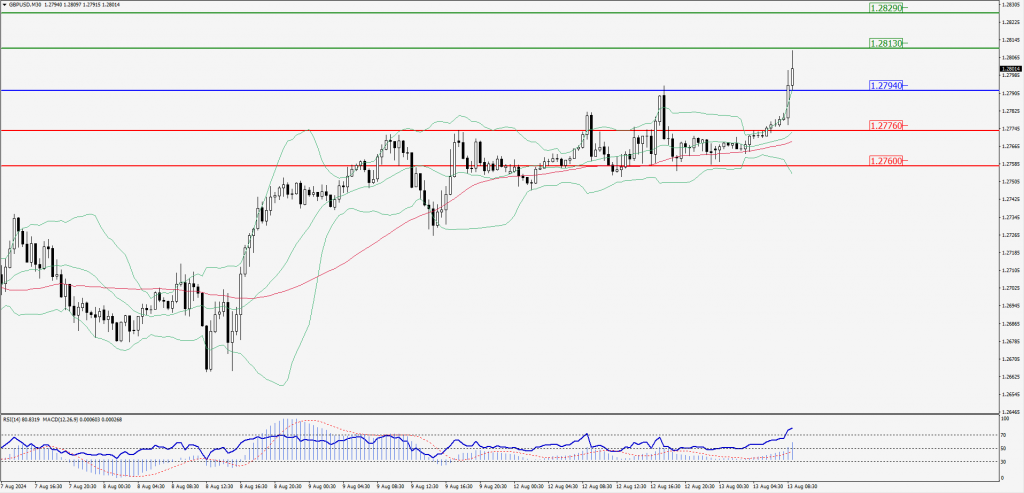
Green Lines Indicate Resistance Levels – Red Lines Indicate Support Levels
Light Blue is a Pivot Point – Black represents the price when the report was produced
USD/JPY Intraday: Trend on the upside
Our pivot point is at 147.730
Preferable Price Action: Buy position above pivot with the target at 148.100 and 148.410 in extension.
Alternative Price Action: The downside breakout of the pivot would call for 147.360 and 147.020.
Comment: MACD is above 50 levels and Pairs above its 20MA & 55MA.
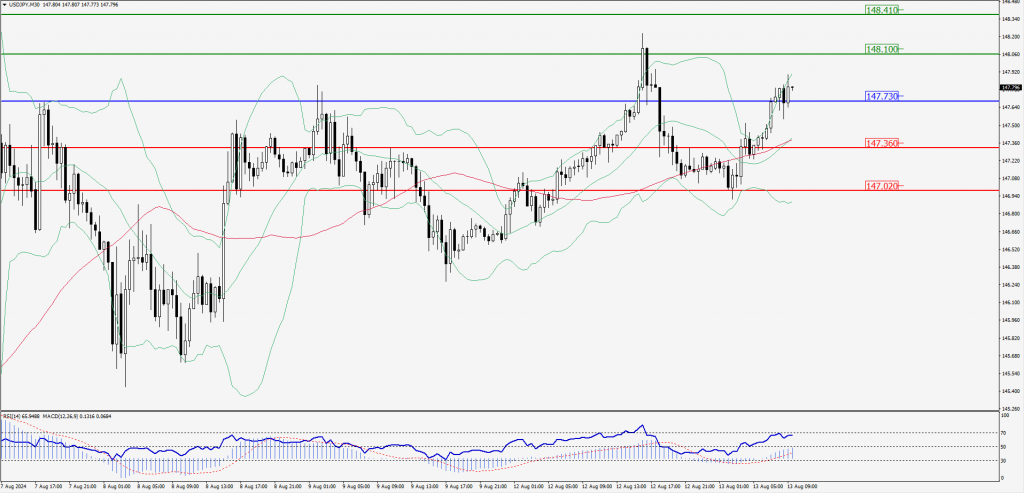
Green Lines Indicate Resistance Levels – Red Lines Indicate Support Levels
Light Blue is a Pivot Point – Black represents the price when the report was produced
AUD/USD Intraday: Trend on the upside
Our pivot point is at 0.65880
Preferable Price Action: Buy positions above pivot with targets at 0.66020 & 0.66130 in extension.
Alternative Price Action: Below pivot a further downside with 0.65740 & 0.65630 as targets.
Comment: RSI is above 50 levels.
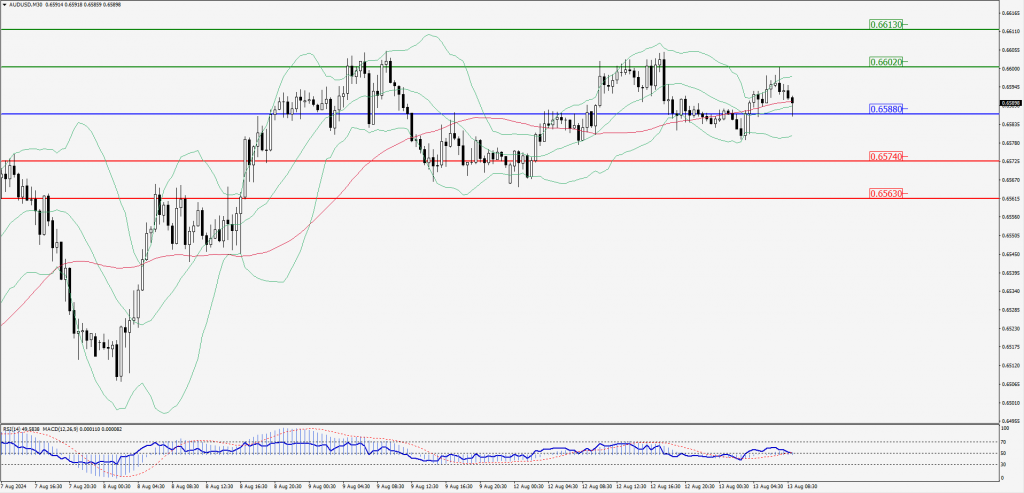
Green Lines Indicate Resistance Levels – Red Lines Indicate Support Levels
Light Blue is a Pivot Point – Black represents the price when the report was produced
CRUDEOIL Intraday: Trend on the upside
Our pivot point is at 77.89
Preferable Price Action: Above pivot buy oil with 78.63 & 79.21 as targets.
Alternative Price Action: Sell crude below pivot with targets at 77.21 and 76.53 in extension.
Comment: RSI is above 50 levels and pairs above its 55MA & 20MA.
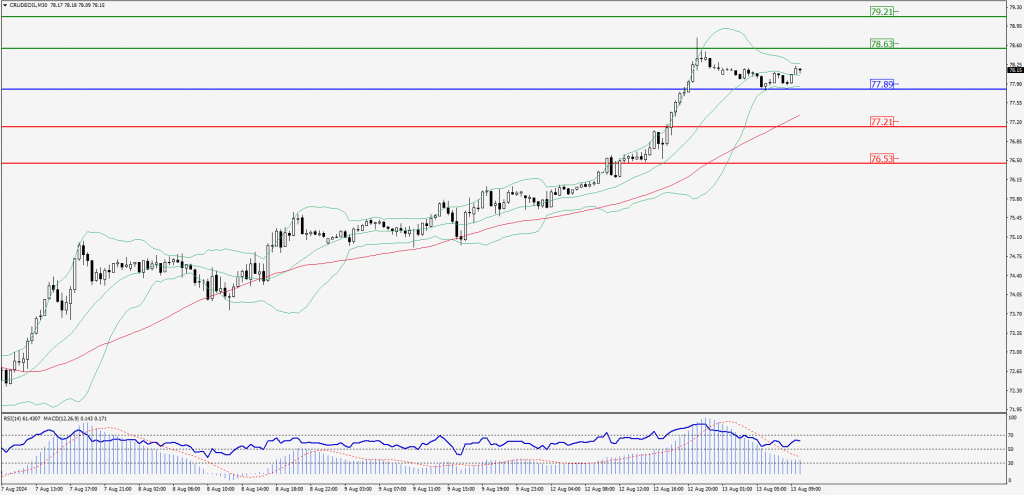
Green Lines Indicate Resistance Levels – Red Lines Indicate Support Levels
Light Blue is a Pivot Point – Black represents the price when the report was produced
XAU/USD Intraday: Trend on the upside
Our pivot point is at 2460.40
Preferable Price Action: Further upside to 2473.60 and 2483.60.
Alternative Price Action: If the price gives an downside breakout of a pivot, then the price extends to 2448.10 and 2436.70.
Comment: MACD is above 50 levels and pairs above its 20MA.
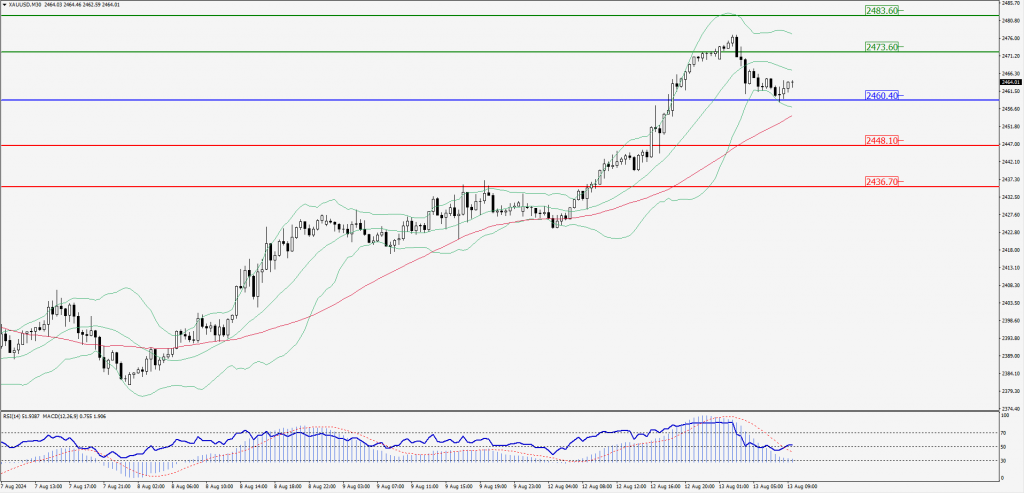
Green Lines Indicate Resistance Levels – Red Lines Indicate Support Levels
Light Blue is a Pivot Point – Black represents the price when the report was produced
Dow Jones Intraday: Trend on the upside
Our pivot point is 39,438.80
Preferable Price Action: Take buy positions above the pivot with targets at 39,593.30 & 39,711.30.
Alternative Price Action: Below 39,437.50 looks for further downside to 39,280.90 & 39,144.60.
Comment: RSI is above 50 levels and pairs above its 55MA.
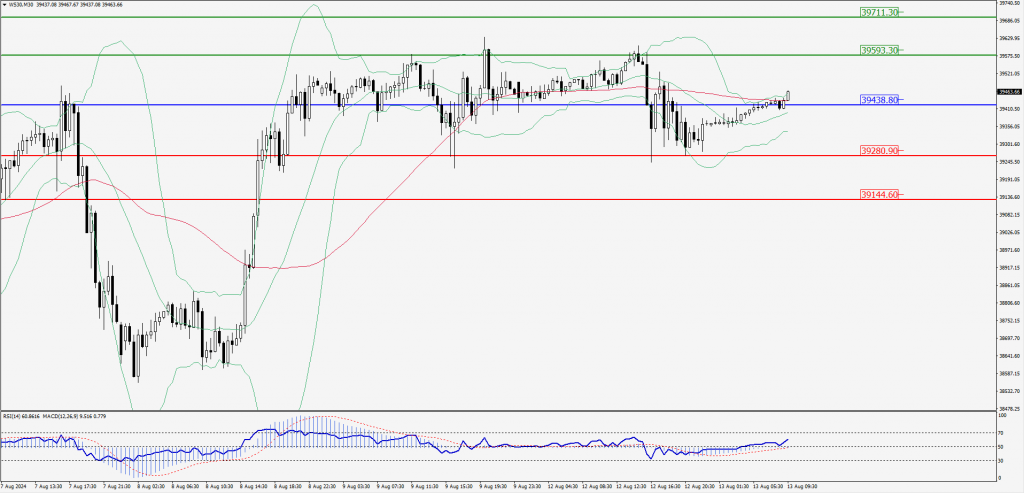
Green Lines Indicate Resistance Levels – Red Lines Indicate Support Levels
Light Blue is a Pivot Point – Black represents the price when the report was produced