Market Wrap: Stocks, Bonds, Commodities
Most Asian currencies weakened slightly on Monday as traders turned slightly biased towards the dollar in anticipation of key U.S. inflation data this week, which is expected to offer more cues on interest rates.
The Dow Jones Industrial Average rose 51.05 points to 39,497.54, the S&P 500 gain 0.47% to 5,344.16 and the Nasdaq Composite ascend 85.28 points to 16,745.30.
MSCI’s index of Asia-Pacific stocks outside Japan is up 0.36% to 680.88 levels. The Australian index was higher by 0.46% to 7,813.70. Japanese Nikkei Index increase 0.56% today.
European stocks were positive on Monday, with the Stoxx Europe 50 Index increase 0.27% to 4,687.85, Germany’s DAX ascend 0.40% to 17,772.05, and France’s CAC higher 0.25% to 7,287.85 and U.K.’s FTSE 100 gain 0.63% to 8,219.16.
Benchmark 10-year U.S. Treasury rose as demand for safe assets slipped again, today 10-year bond yields increase 0.43% to 3.9610.
Oil prices rose for a fifth consecutive session on Monday, extending gains from last week’s more than 3% rise, as U.S. recession fears eased while geopolitical tensions in the Middle East supported prices.
Spot Brent crude oil increase 0.64% to $80.17 per barrel. US West Texas Intermediate crude is increase 0.87% to $77.51 a barrel.
The yellow metal gold is up 0.16% to 2,477.35 dollars per ounce.
Market Wrap: Forex
The yen extended its slow decline against the dollar in trading thinned by a Japanese holiday on Monday, with market participants still ambivalent about the odds of a deep Fed rate cut next month.
Today, the U.S. dollar index measures the Greenback against a trade-weighted basket of six major currencies, which increase 0.01% to 102.967.
The Euro US Dollar (EUR/USD) is a widely traded pair that is increase 0.09% today. This left the pair trading around $1.0926.
The Japanese yen was will move positive against the U.S. dollar on Monday. Today USD/JPY is trades pair that increase 0.41% to the 147.200 level.
Another commodity-related currency positive against the U.S dollar, AUD/USD gain 0.14% to 0.65820, and NZD/USD increase 0.18% to 0.60090 level.
EUR/USD Intraday: Support level at 1.09200
Our pivot point is at 1.09220
Preferable Price Action: Take buy positions above pivot level with targets at 1.09290 & 1.09370 in extension.
Alternative Price Action: Sell pivot looks for a further downside to 1.09110 & 1.09030.
Comment: RSI is above 50 levels and Pairs above its 55MA & 20MA.
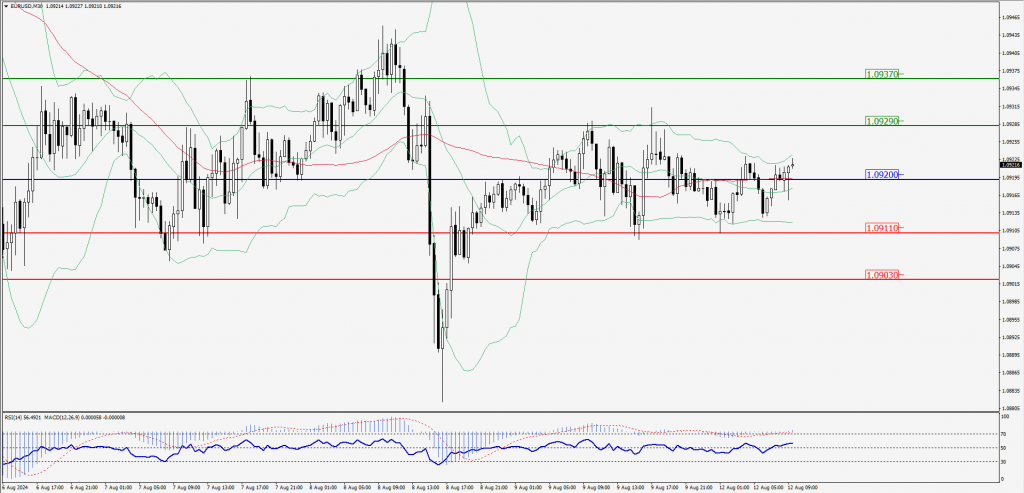
Green Lines Indicate Resistance Levels – Red Lines Indicate Support Levels
Light Blue is a Pivot Point – Black represents the price when the report was produced
GBP/USD Intraday: Trend on the upside
Our pivot point is at 1.27780
Preferable Price Action: Buy positions above pivot with targets at 1.27970 & 1.28120 in extension.
Alternative Price Action: The price below pivot would call for further downside to 1.27590 & 1.27420.
Comment: RSI is above 50 levels and Pairs above its 20MA & 55MA.
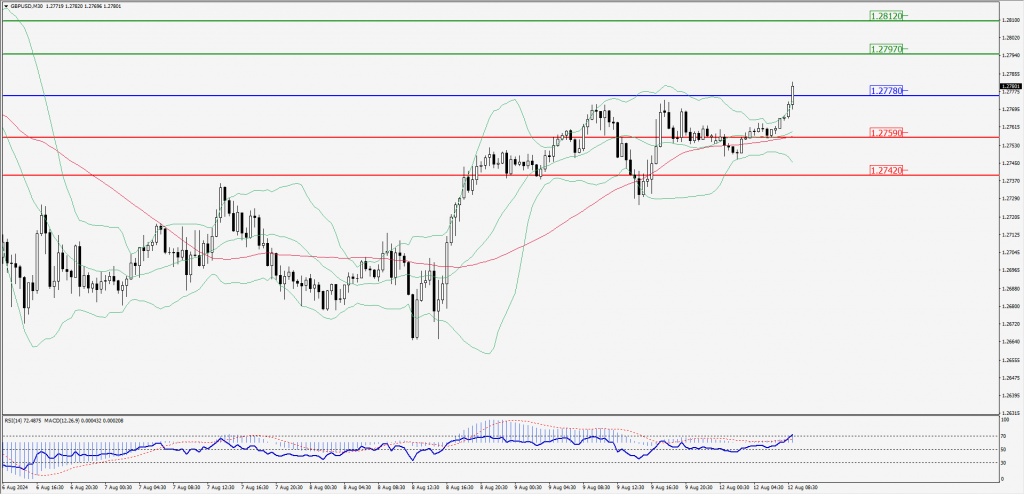
Green Lines Indicate Resistance Levels – Red Lines Indicate Support Levels
Light Blue is a Pivot Point – Black represents the price when the report was produced
USD/JPY Intraday: Trend on the upside
Our pivot point is at 147.100
Preferable Price Action: Buy position above pivot with the target at 147.550 and 147.970 in extension.
Alternative Price Action: The downside breakout of the pivot would call for 146.620 and 146.180.
Comment: MACD is above 50 levels and Pairs above its 20MA & 55MA.
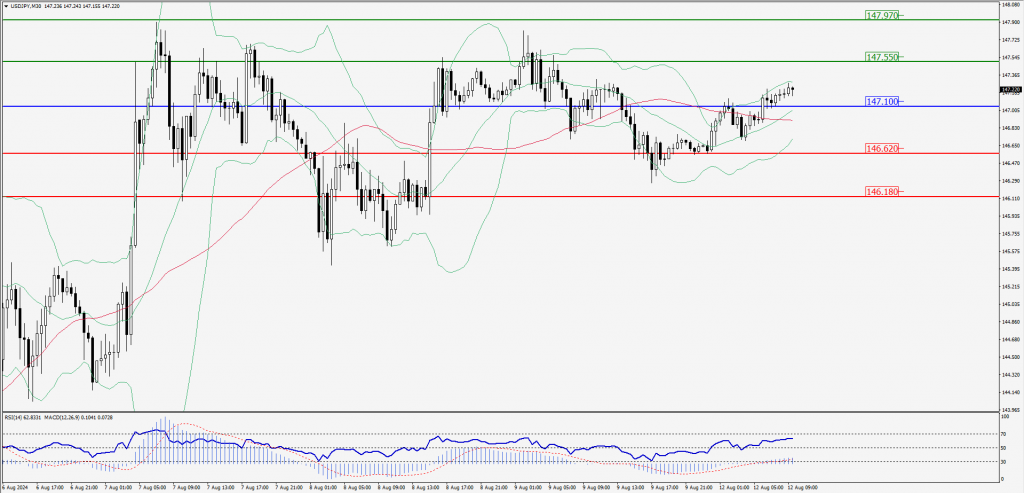
Green Lines Indicate Resistance Levels – Red Lines Indicate Support Levels
Light Blue is a Pivot Point – Black represents the price when the report was produced
AUD/USD Intraday: Trend on the upside
Our pivot point is at 0.65830
Preferable Price Action: Buy positions above pivot with targets at 0.66000 & 0.66140 in extension.
Alternative Price Action: Below pivot a further downside with 0.65650 & 0.65510 as targets.
Comment: RSI is above 50 levels and Pairs above its 55MA & 20MA.
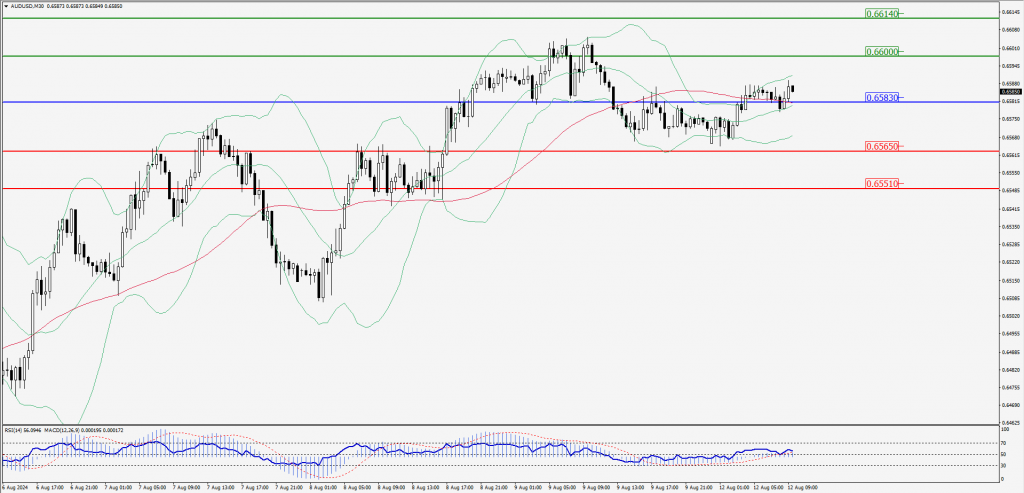
Green Lines Indicate Resistance Levels – Red Lines Indicate Support Levels
Light Blue is a Pivot Point – Black represents the price when the report was produced
CRUDEOIL Intraday: Trend on the upside
Our pivot point is at 75.97
Preferable Price Action: Above pivot buy oil with 76.72 & 77.39 as targets.
Alternative Price Action: Sell crude below pivot with targets at 75.18 and 74.51 in extension.
Comment: RSI is above 50 levels and pairs above its 50MA & 20MA.
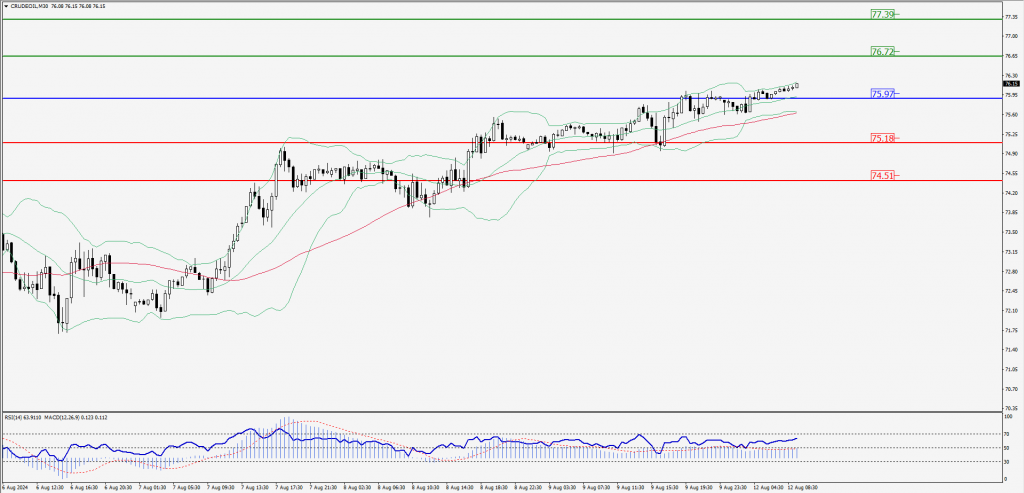
Green Lines Indicate Resistance Levels – Red Lines Indicate Support Levels
Light Blue is a Pivot Point – Black represents the price when the report was produced
XAU/USD Intraday: Trend on the upside
Our pivot point is at 2432.70
Preferable Price Action: Further upside to 2441.60 and 2449.50.
Alternative Price Action: If the price gives an downside breakout of a pivot, then the price extends to 2423.80 and 2415.30.
Comment: MACD is above 50 levels and pairs above its 55MA & 20MA.
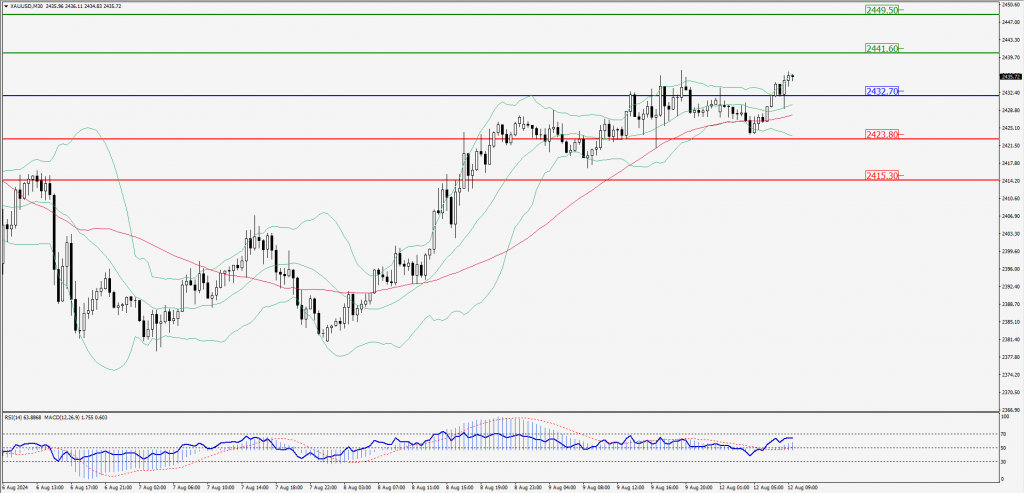
Green Lines Indicate Resistance Levels – Red Lines Indicate Support Levels
Light Blue is a Pivot Point – Black represents the price when the report was produced
Dow Jones Intraday: Trend on the upside
Our pivot point is 39,437.50
Preferable Price Action: Take buy positions above the pivot with targets at 39,593.60 & 39,727.10.
Alternative Price Action: Below 39,437.50 looks for further downside to 39,281.40 & 39,142.70.
Comment: RSI is above 50 levels and pairs above its 55MA & 20MA.
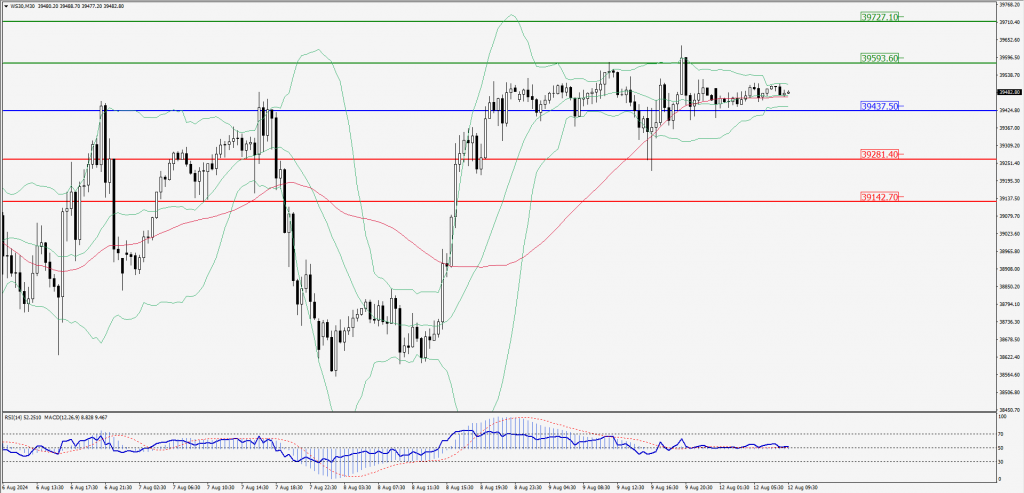
Green Lines Indicate Resistance Levels – Red Lines Indicate Support Levels
Light Blue is a Pivot Point – Black represents the price when the report was produced