Market Wrap: Stocks, Bonds, Commodities
Most Asian currencies firmed on Wednesday, while the dollar dropped after a soft U.S. producer inflation reading pushed up hopes that similar easing in consumer inflation will spur deeper interest rate cuts.
The Dow Jones Industrial Average rose 408.63 points to 39,765.64, the S&P 500 gain 1.68% to 5,434.43 and the Nasdaq Composite ascend 407.00 points to 17,187.61.
MSCI’s index of Asia-Pacific stocks outside Japan is up 0.38% to 685.21 levels. The Australian index was higher by 0.31% to 7,850.70. Japanese Nikkei Index increase 0.54% today.
European stocks were positive on Wednesday, with the Stoxx Europe 50 Index increase 0.52% to 4,719.25, Germany’s DAX ascend 0.44% to 17,884.75, and France’s CAC higher 0.68% to 7,325.23 and U.K.’s FTSE 100 gain 0.53% to 8,278.68.
Benchmark 10-year U.S. Treasury rose as demand for safe assets slipped again, today 10-year bond yields decrease 0.18% to 3.8500.
Oil prices climbed on Wednesday after an industry report showed U.S. crude and gasoline inventories fell and as the market watched for a possible widening of the Israel-Gaza war, which may impact global oil supplies.
Spot Brent crude oil decrease 0.56% to $81.84 per barrel. US West Texas Intermediate crude is increase 0.51% to $81.10 a barrel.
The yellow metal gold is up 0.03% to 2,508.45 dollars per ounce.
Market Wrap: Forex
The dollar remained on the back foot on Wednesday after tumbling versus major peers overnight as a benign reading for U.S. producer prices reinforced bets on Federal Reserve interest rate cuts this year.
Today, the U.S. dollar index measures the Greenback against a trade-weighted basket of six major currencies, which increase 0.06% to 102.437.
The Euro US Dollar (EUR/USD) is a widely traded pair that is either up or up 0.08% today. This left the pair trading around $1.10010.
The Japanese yen was will move positive against the U.S. dollar on Wednesday. Today USD/JPY is trades pair that increase 0.15% to the 147.22 level.
Another commodity-related currency mixed against the U.S dollar, AUD/USD gain 0.15% to 0.66410, and NZD/USD decrease 0.99% to 0.60170 level.
EUR/USD Intraday: Trend on the upside
Our pivot point is at 1.09910
Preferable Price Action: Take buy positions above pivot level with targets at 1.10070 & 1.10190 in extension.
Alternative Price Action: Sell pivot looks for a further downside to 1.09770 & 1.09630.
Comment: RSI is above 50 levels and Pairs above its 20MA & 50MA.
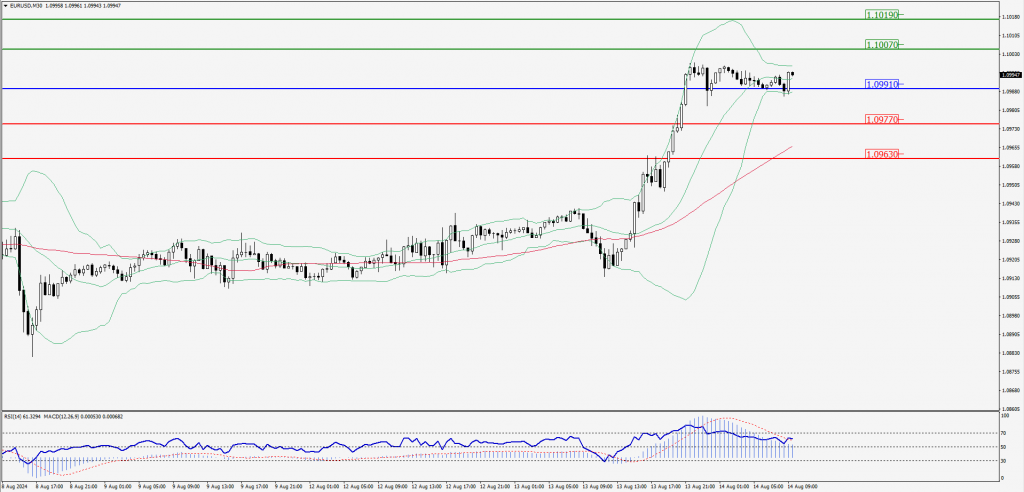
Green Lines Indicate Resistance Levels – Red Lines Indicate Support Levels
Light Blue is a Pivot Point – Black represents the price when the report was produced
GBP/USD Intraday: Trend on the downside
Our pivot point is at 1.28400
Preferable Price Action: Sell positions below pivot with targets at 1.28140 & 1.27920 in extension.
Alternative Price Action: The price above pivot would call for further upside to 1.28640 & 1.28890.
Comment: RSI is below 50 levels and Pairs below its 20MA.
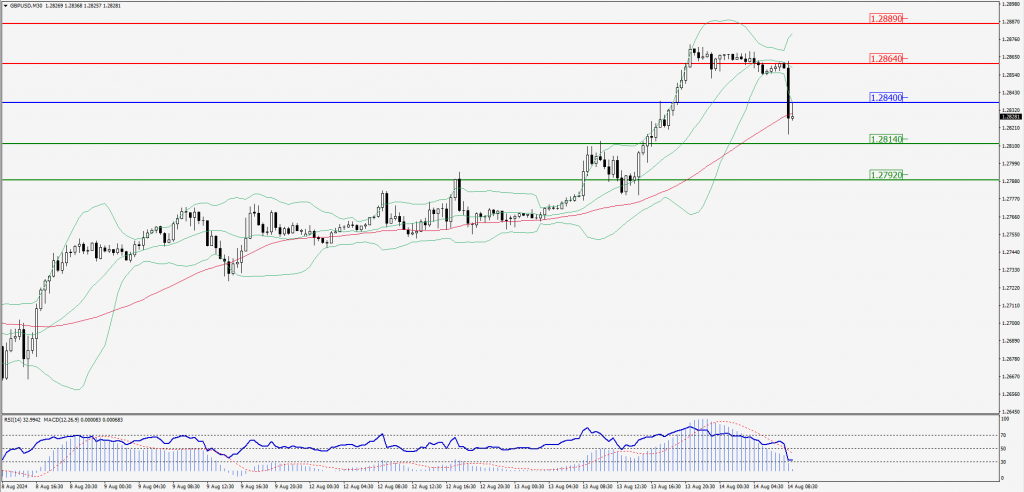
Green Lines Indicate Resistance Levels – Red Lines Indicate Support Levels
Light Blue is a Pivot Point – Black represents the price when the report was produced
USD/JPY Intraday: Trend on the upside
Our pivot point is at 147.140
Preferable Price Action: Buy position above pivot with the target at 147.490 and 147.760 in extension.
Alternative Price Action: The downside breakout of the pivot would call for 146.790 and 146.500.
Comment: MACD is above 50 levels and Pairs above its 20MA.
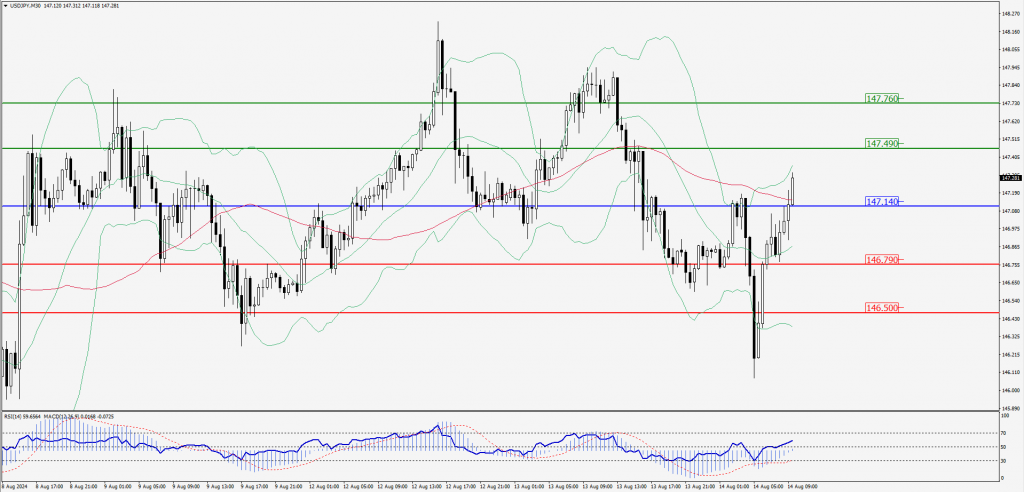
Green Lines Indicate Resistance Levels – Red Lines Indicate Support Levels
Light Blue is a Pivot Point – Black represents the price when the report was produced
AUD/USD Intraday: Trend on the upside
Our pivot point is at 0.66290
Preferable Price Action: Buy positions above pivot with targets at 0.66430 & 0.66540 in extension.
Alternative Price Action: Below pivot a further downside with 0.66160 & 0.66030 as targets.
Comment: RSI is above 50 levels and pairs above its 55MA.
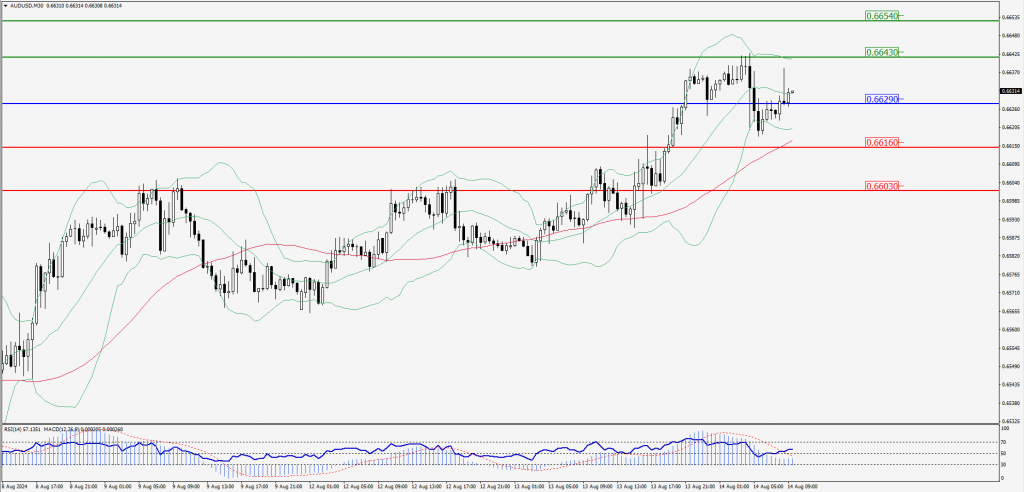
Green Lines Indicate Resistance Levels – Red Lines Indicate Support Levels
Light Blue is a Pivot Point – Black represents the price when the report was produced
CRUDEOIL Intraday: Trend on the downside
Our pivot point is at 77.51
Preferable Price Action: Below pivot sell oil with 76.87 & 76.29 as targets.
Alternative Price Action: Buy crude above pivot with targets at 78.11 and 78.67 in extension.
Comment: RSI is below 50 levels and pairs below its 55MA.
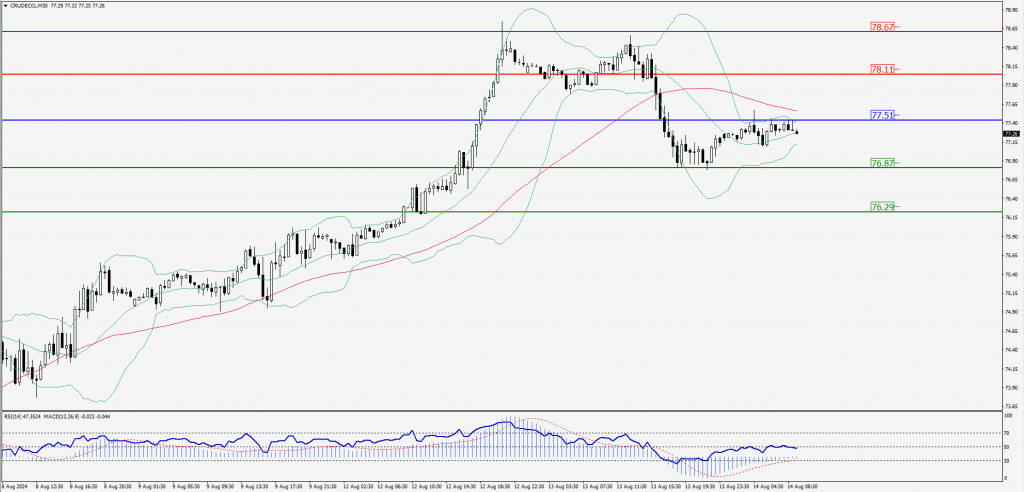
Green Lines Indicate Resistance Levels – Red Lines Indicate Support Levels
Light Blue is a Pivot Point – Black represents the price when the report was produced
XAU/USD Intraday: Trend on the upside
Our pivot point is at 2463.90
Preferable Price Action: Further upside to 2476.20 and 2487.10.
Alternative Price Action: If the price gives an downside breakout of a pivot, then the price extends to 2451.40 and 2439.90.
Comment: MACD is above 50 levels and pairs above its 20MA & 55MA.
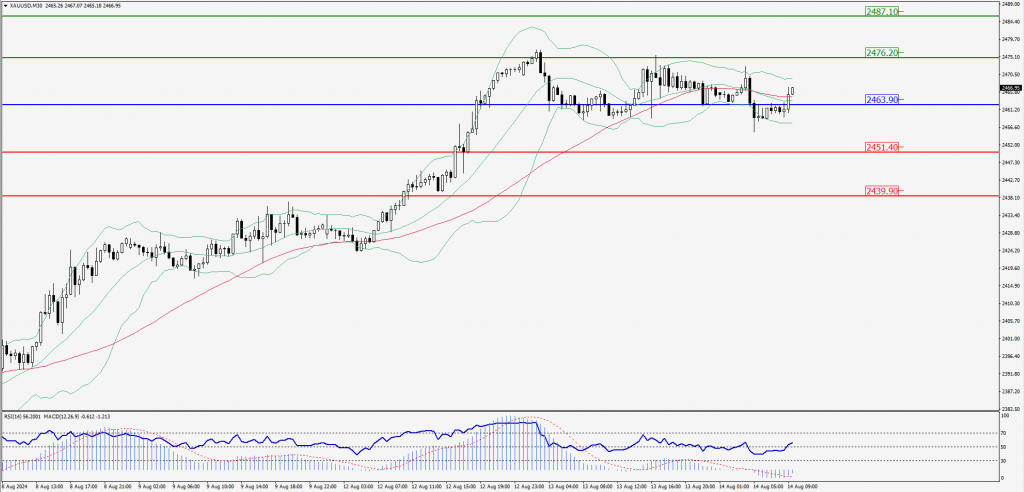
Green Lines Indicate Resistance Levels – Red Lines Indicate Support Levels
Light Blue is a Pivot Point – Black represents the price when the report was produced
Dow Jones Intraday: Major trend on the upside
Our pivot point is 39,768.20
Preferable Price Action: Take buy positions above the pivot with targets at 39,957.90 & 40,120.10.
Alternative Price Action: Below 39,768.20 looks for further downside to 39,583.50 & 39,403.80.
Comment: RSI is above 50 levels and pairs above its 55MA & 20MA.
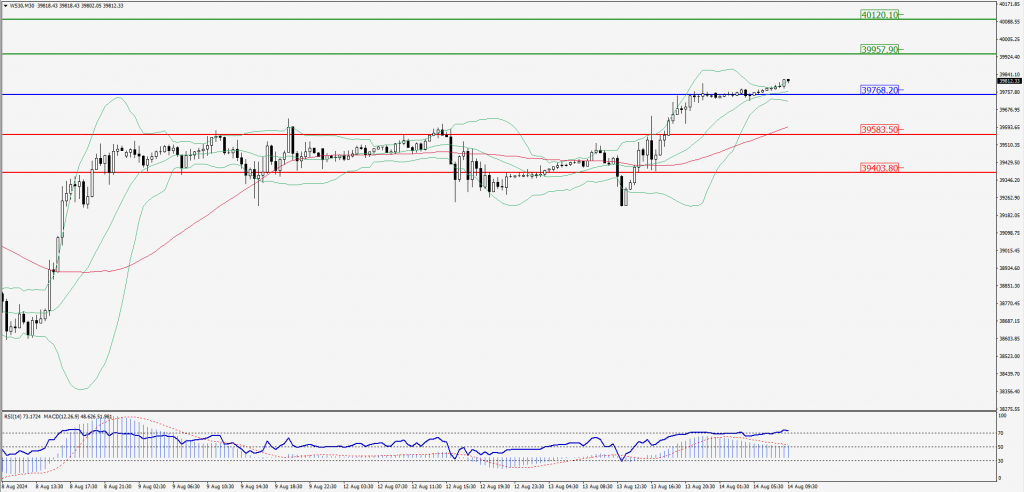
Green Lines Indicate Resistance Levels – Red Lines Indicate Support Levels
Light Blue is a Pivot Point – Black represents the price when the report was produced