Market Wrap: Stocks, Bonds, Commodities
Wall Street closed sharply lower on Wednesday as investors started the holiday-shortened week in a risk-off mood, as rising bond yields weighed on market-leading growth stocks ahead of crucial inflation data.
The S&P 500 lose(0.34%) ended at 4,397.45 points, while the Nasdaq Composite down 0.30% to 13,371.57. The Dow Jones Industrial was fell 0.26% to 34,220.36.
MSCI’s index of Asia-Pacific stocks outside Japan is ascend 0.80% to 704.99 levels. Australian index higher 0.34% to 7,479.00. Japanese Nikkei Index surge 1.93% to 26,843.49.
European stocks were Negative on Wednesday, with the Stoxx Europe 50 Index lose 0.03% to 3,830.45 Germany’s DAX drop 0.32% to 14,082.19, and France’s CAC up 0.22% to 6,553.73, and U.K.’s FTSE 100 increase 0.12% to 7,586.09.
Benchmark 10-year U.S. Treasury fell as demand for safe assets ascend again, today 10-year bond yields a positive 2.780.
Oil prices settled higher on Tuesday as lockdowns eased in Shanghai and as Russian oil and gas condensate production fell to 2020 lowsand OPEC warned it would be impossible to replace potential supply losses from Russia.
Spot Brent crude oil fell 0.46% to $104.18 per barrel. US West Texas Intermediate crude down 0.63% to $99.97 a barrel.
The yellow metal gold is decline 0.23% to 1,971.60 dollars per ounce.
Market Wrap: Forex
The euro was pinned to a five-week low on Wednesday as prospects for peace in Ukraine seemed to darken, while the kiwi was whipsawed after New Zealand’s central bank announced its sharpest rate hike in two decades to curb inflation.
Today, the U.S. dollar index measures the Greenback against a trade-weighted basket of six major currencies, which is an increase of 0.03% to 100.310.
The Euro US Dollar (EUR/USD) is a widely traded pair that is positive today. This left the pair trading around $1.08380.
The Japanese yen was positive against the U.S. dollar on Wednesday as the stock up. Today USD/JPY is rose 0.55% to 126.030 level.
Another commodity-related currency negative against the U.S dollar, AUD/USD down 0.21% to 0.74420, and NZD/USD lower 0.69% to 0.68010 level.
EUR/USD Intraday: Trend on The Downside
Our pivot point is at 1.08510
Preferable Price Action: Take Short positions below pivot level with targets at 1.07880 & 1.07400 in extension.
Alternative Price Action: Above pivot looks for a further upside to 1.09120 & 1.09640.
Comment: RSI below 50 levels and Pair below its 20MA & 50MA.
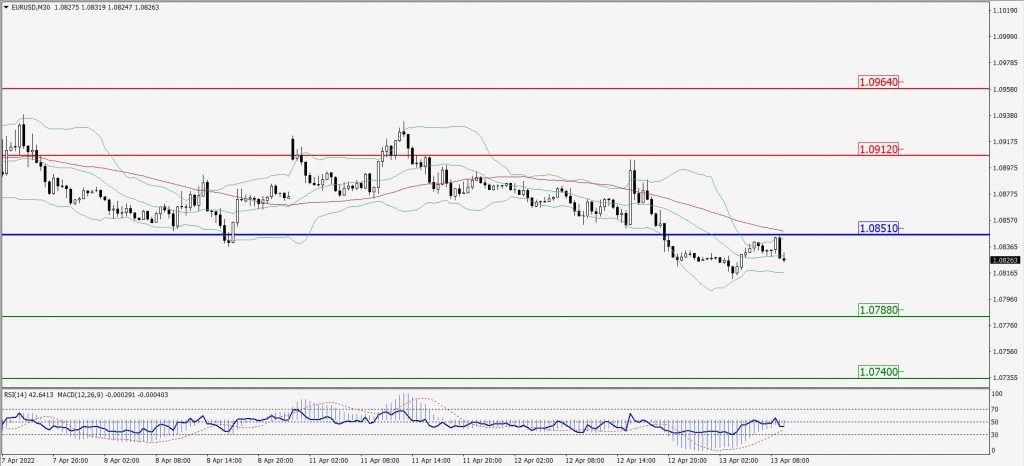
Green Lines Indicate Resistance Levels – Red Lines Indicates Support Levels
Light Blue is a Pivot Point – Black represents the price when the report was produced
GBP/USD Intraday: Major Support Level at 1.30090
Our pivot point is at 1.30090
Preferable Price Action: Sell positions below pivot with targets at 1.29400 & 1.28880 in extension.
Alternative Price Action: The price above pivot would call for further upside to 1.30680 & 1.31170.
Comment: RSI below 50 levels and Pair below its 20MA & 55MA.
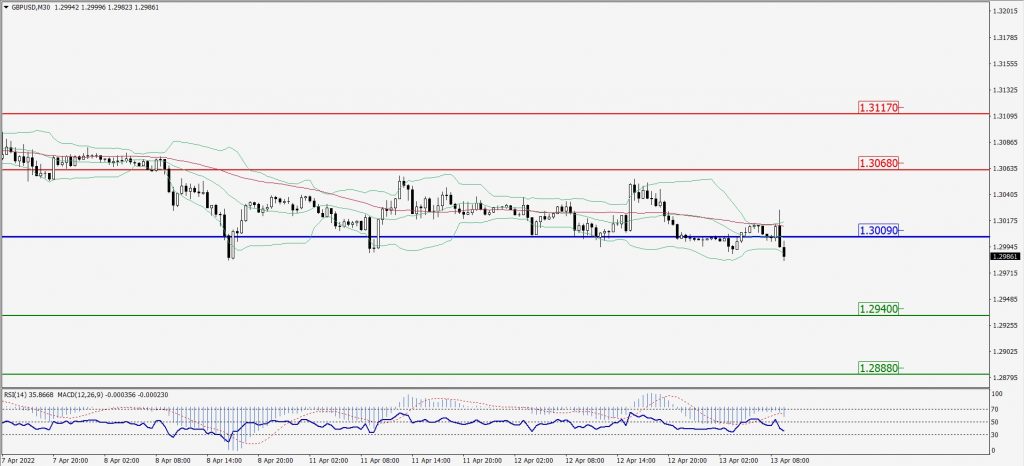
Green Lines Indicate Resistance Levels – Red Lines Indicates Support Levels
Light Blue is a Pivot Point – Black represents the price when the report was produced
USD/JPY Intraday: Trend on The Upside
Our pivot point is at 125.960
Preferable Price Action: Buy position above pivot with the target at 127.190 and 128.060 in extension.
Alternative Price Action: The downside breakout of the pivot would call for 124.670 and 123.760.
Comment: MACD in positive territory and Pair above its 20MA & 55MA.
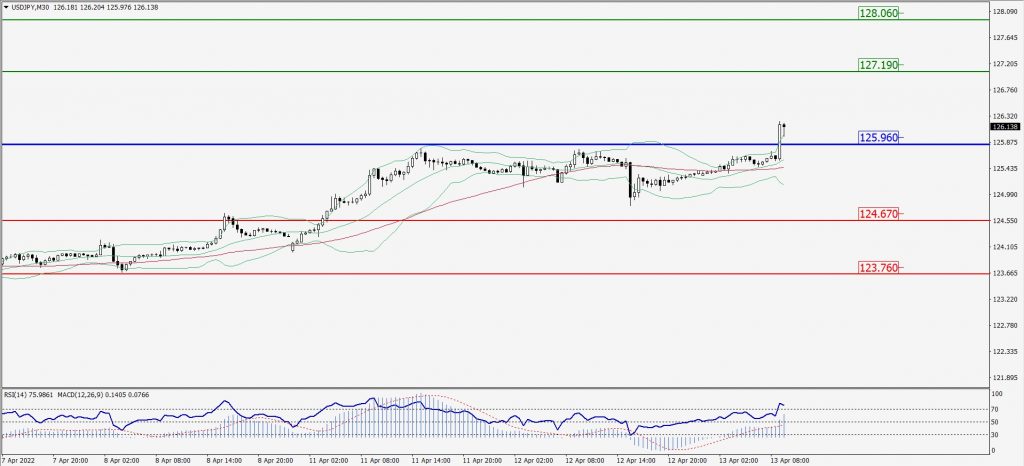
Green Lines Indicate Resistance Levels – Red Lines Indicates Support Levels
Light Blue is a Pivot Point – Black represents the price when the report was produced
AUD/USD Intraday: Trend on The Downside
Our pivot point is at 0.74540
Preferable Price Action: Sell Positions below pivot with targets at 0.73970 & 0.73470 in extension.
Alternative Price Action: Above pivot looks for a further upside with 0.75080 & 0.75600 as targets.
Comment: RSI below 50 levels and Pair above its 20 MA & 55MA.
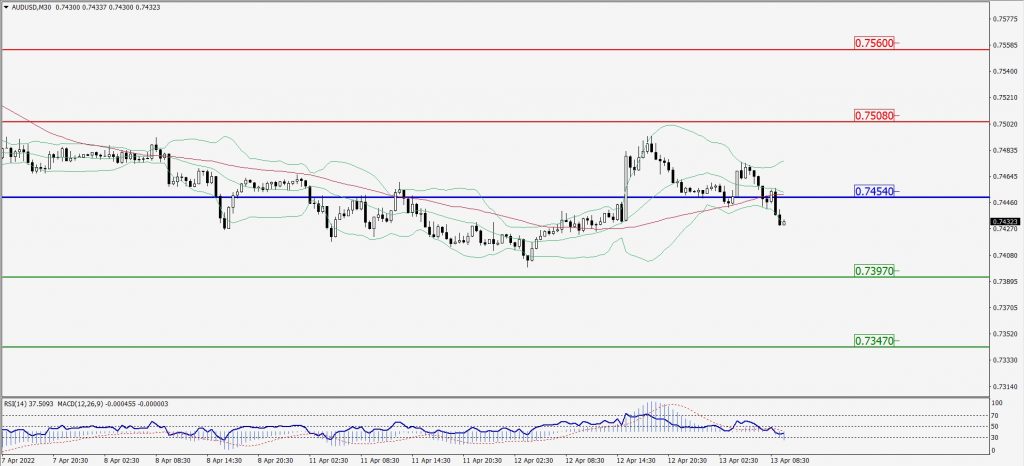
Green Lines Indicate Resistance Levels – Red Lines Indicates Support Levels
Light Blue is a Pivot Point – Black represents the price when the report was produced
CRUDEOIL Intraday: Trend on The Upside
Our pivot point is at 99.50
Preferable Price Action: Above pivots Buy oil with 102.50 & 104.70 as targets.
Alternative Price Action: Sell crude below pivot with targets at 96.50 and 94.50 in extension.
Comment: MACD is in the flat territory and Pair above 55MA.
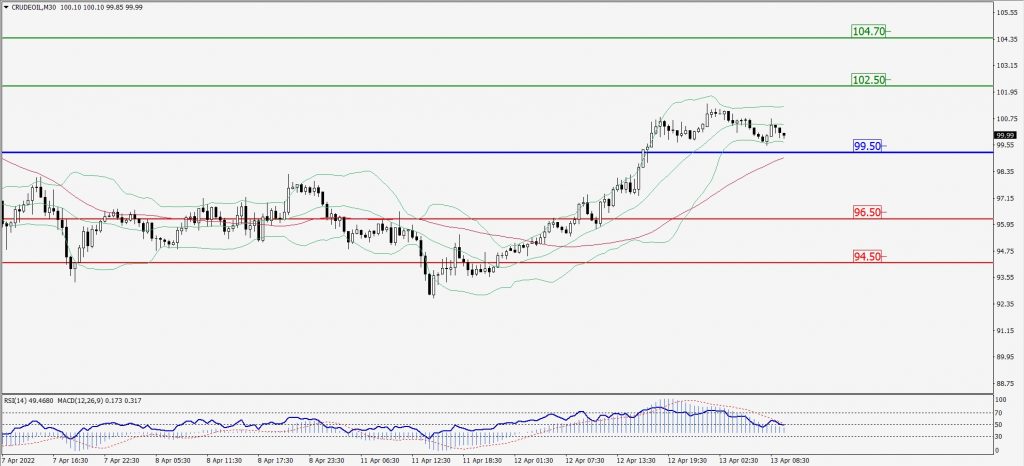
Green Lines Indicate Resistance Levels – Red Lines Indicates Support Levels
Light Blue is a Pivot Point – Black represents the price when the report was produced
XAU/USD Intraday: Major Trend on The Upside
Our pivot point is 1965.00
Preferable Price Action: Further upside to 1984.30 and 2000.00.
Alternative Price Action: If the price gives an upside breakout of a pivot, then the price extends to 1946.00 and 1931.00.
Comment: MACD is a positive territory and Pair above 55MA.
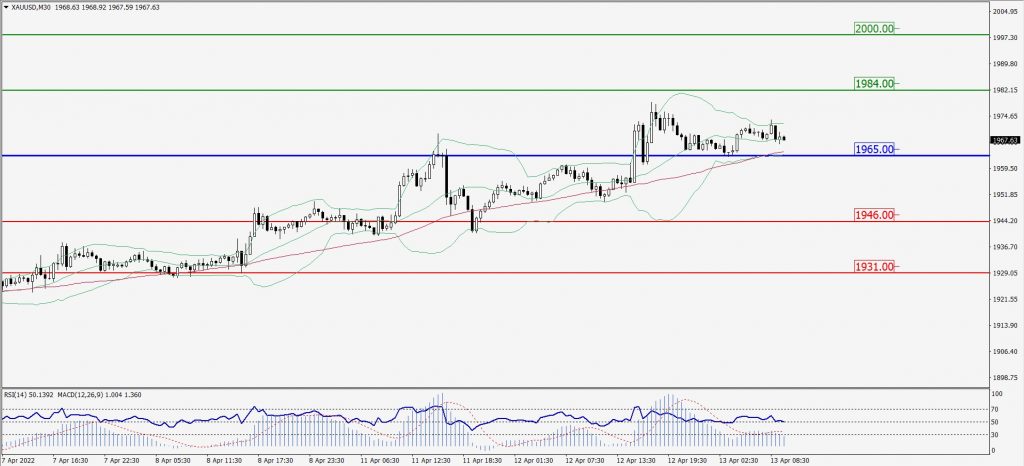
Green Lines Indicate Resistance Levels – Red Lines Indicates Support Levels
Light Blue is a Pivot Point – Black represents the price when the report was produced
Dow Jones Intraday: In a Consolidation Zone
Our pivot point is 34,297.00
Preferable Price Action: Take Buy positions above pivot with targets at 34,615.00 & 34,858.00.
Alternative Price Action: Below 34,297.00 looks for further downside to 34,035.00 & 34,816.00.
Comment: RSI below 50 levels and pair above 55MA.
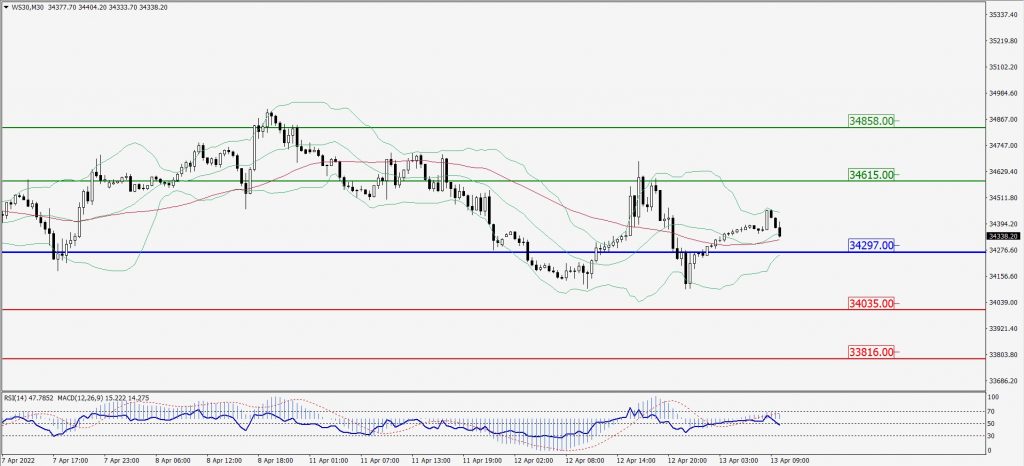
Green Lines Indicate Resistance Levels – Red Lines Indicates Support Levels
Light Blue is a Pivot Point – Black represents the price when the report was produced