Market Wrap: Stocks, Bonds, Commodities
Asian shares tracked Wall Street higher on Thursday, while U.S. Treasury yields eased and the dollar retreated, as the latest U.S. data raised hopes that inflation may be close to peaking, though several major central banks raised rates aggressively.
The S&P 500 gain(1.12%) ended at 4,446.59 points, while the Nasdaq Composite up 2.03% to 13,643.59. The Dow Jones Industrial was rose 1.01% to 34,564.59.
MSCI’s index of Asia-Pacific stocks outside Japan is ascend 0.20% to 708.06 levels. Australian index higher 0.59% to 7,523.40. Japanese Nikkei Index surge 1.22% to 27,172.00.
European stocks were Negative on Thursday, with the Stoxx Europe 50 Index gain 0.48% to 3,846.15 Germany’s DAX ascend 0.42% to 14,134.19, and France’s CAC up 0.46% to 6,571.73, and U.K.’s FTSE 100 decrease 0.19% to 7,561.90.
Benchmark 10-year U.S. Treasury fell as demand for safe assets ascend again, today 10-year bond yields a negative 2.660.
Oil futures were down slightly Thursday morning, after rising sharply in the first half of the week, as traders weighed a larger-than-expected build in U.S. oil stocks against tightening global supply.
Spot Brent crude oil fell 1.15% to $107.52 per barrel. US West Texas Intermediate crude down 1.38% to $102.83 a barrel.
The yellow metal gold is decline 0.35% to 1,977.80 dollars per ounce.
Market Wrap: Forex
The dollar was carrying a couple of bruises on Wednesday as Federal Reserve officials played down the chance of a half-point rate hike in March and a rally in global equity markets tarnished some of its safe-haven allure.
Today, the U.S. dollar index measures the Greenback against a trade-weighted basket of six major currencies, which is an increase of 0.24% to 99.680.
The Euro US Dollar (EUR/USD) is a widely traded pair that is positive today. This left the pair trading around $1.09080.
The Japanese yen was positive against the U.S. dollar on Thursday as the stock up. Today USD/JPY is fell 0.55% to 125.250 level.
Another commodity-related currency mixed against the U.S dollar, AUD/USD down 0.05% to 0.74450, and NZD/USD higher 0.39% to 0.68200 level.
EUR/USD Intraday: Trend on The Upside
Our pivot point is at 1.09000
Preferable Price Action: Take Buy positions above pivot level with targets at 1.09810 & 1.10410 in extension.
Alternative Price Action: Below pivot looks for a further downside to 1.08250 & 1.07660.
Comment: RSI above 50 levels and Pair above its 20MA & 50MA.
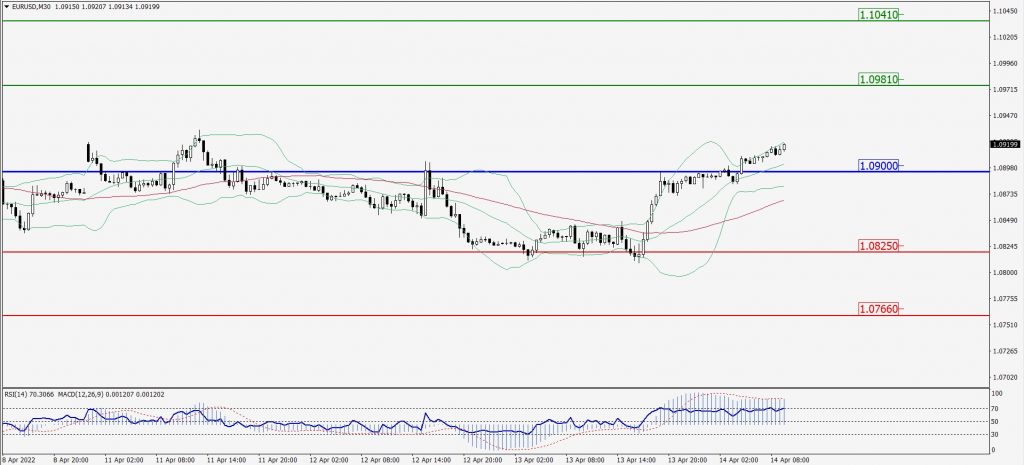
Green Lines Indicate Resistance Levels – Red Lines Indicates Support Levels
Light Blue is a Pivot Point – Black represents the price when the report was produced
GBP/USD Intraday: Major Trend on The Upside
Our pivot point is at 1.31290
Preferable Price Action: Buy positions above pivot with targets at 1.32150 & 1.32920 in extension.
Alternative Price Action: The price below pivot would call for further downside to 1.30490 & 1.29820.
Comment: RSI above 50 levels and Pair above its 20MA & 55MA.
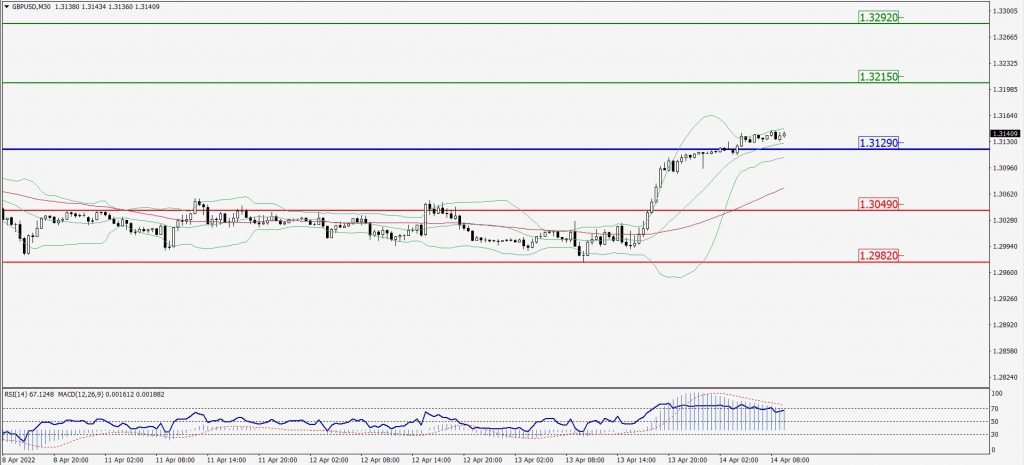
Green Lines Indicate Resistance Levels – Red Lines Indicates Support Levels
Light Blue is a Pivot Point – Black represents the price when the report was produced
USD/JPY Intraday: In a Consolidation Zone
Our pivot point is at 125.850
Preferable Price Action: Sell position below pivot with the target at 124.680 and 123.870 in extension.
Alternative Price Action: The upside breakout of the pivot would call for 126.880 and 127.640.
Comment: MACD in negative territory and Pair below its 20MA & 55MA.
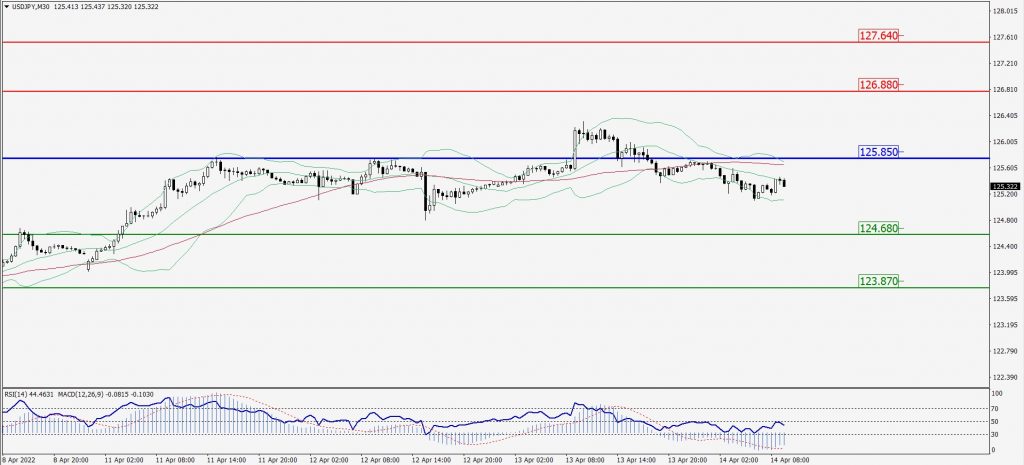
Green Lines Indicate Resistance Levels – Red Lines Indicates Support Levels
Light Blue is a Pivot Point – Black represents the price when the report was produced
AUD/USD Intraday: Major Support Level at 0.74540
Our pivot point is at 0.74540
Preferable Price Action: Buy Positions above pivot with targets at 0.75060 & 0.75460 in extension.
Alternative Price Action: Below pivot looks for a further downside with 0.74050 & 0.73640 as targets.
Comment: RSI above 50 levels and Pair above its 55MA.
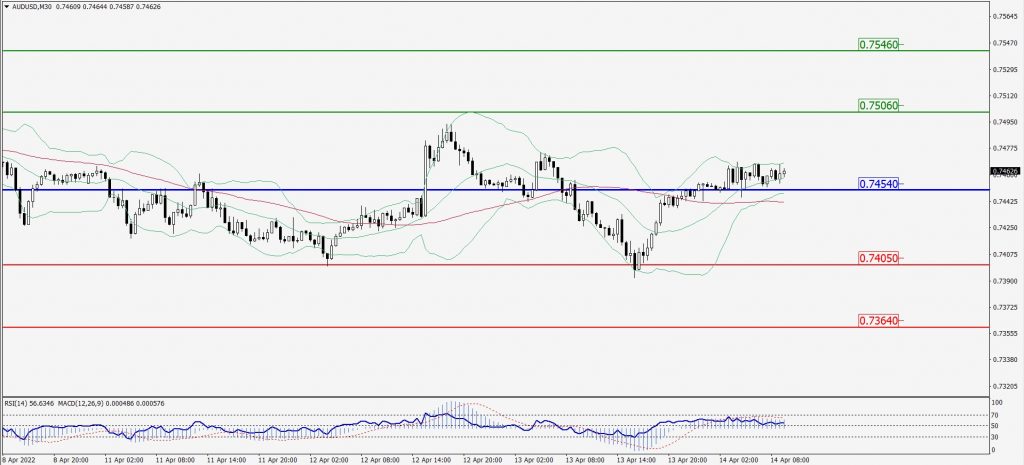
Green Lines Indicate Resistance Levels – Red Lines Indicates Support Levels
Light Blue is a Pivot Point – Black represents the price when the report was produced
CRUDEOIL Intraday: May Trend Reverse from 103.90
Our pivot point is at 103.90
Preferable Price Action: Below pivots sell oil with 100.60 & 97.90 as targets.
Alternative Price Action: Buy crude above pivot with targets at 106.60 and 109.10 in extension.
Comment: MACD is in the negative territory and Pair below 20MA.
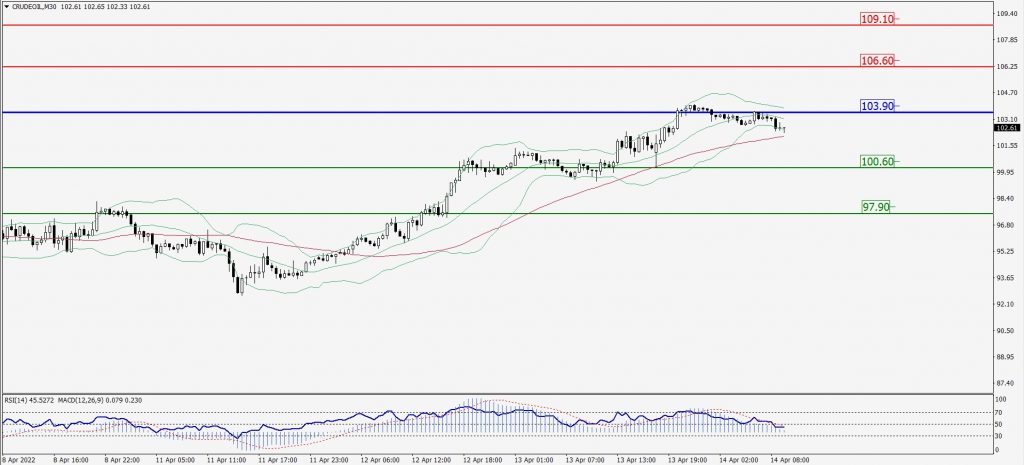
Green Lines Indicate Resistance Levels – Red Lines Indicates Support Levels
Light Blue is a Pivot Point – Black represents the price when the report was produced
XAU/USD Intraday: In a Consolidation Zone
Our pivot point is 1977.50
Preferable Price Action: Further downside to 1958.90 and 1944.40.
Alternative Price Action: If the price gives an upside breakout of a pivot, then the price extends to 1994.50 and 2007.10.
Comment: MACD is a negative territory and Pair below its 20MA & 55MA.
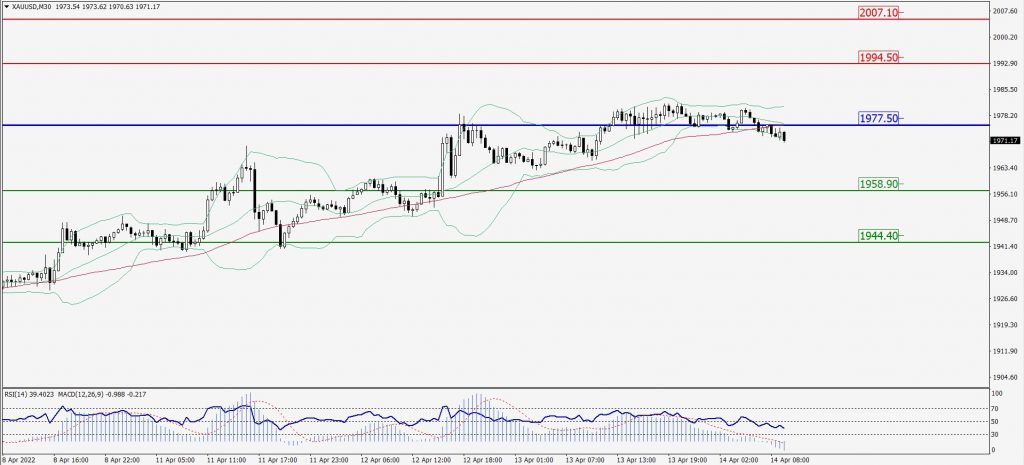
Green Lines Indicate Resistance Levels – Red Lines Indicates Support Levels
Light Blue is a Pivot Point – Black represents the price when the report was produced
Dow Jones Intraday: In a Consolidation Zone
Our pivot point is 34,546.00
Preferable Price Action: Take Buy positions above pivot with targets at 34,842.00 & 35,054.00.
Alternative Price Action: Below 34,546.00 looks for further downside to 34,301.00 & 34,083.00.
Comment: RSI above 50 levels and pair above 55MA.
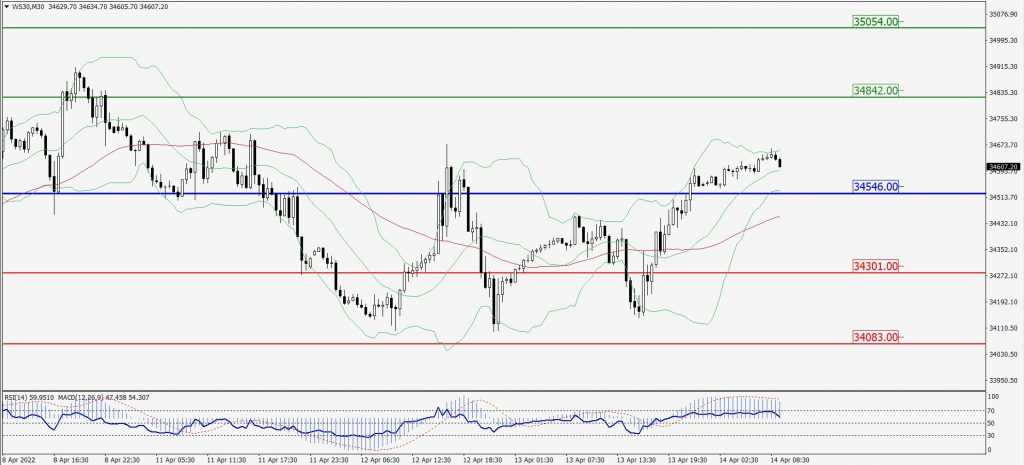
Green Lines Indicate Resistance Levels – Red Lines Indicates Support Levels
Light Blue is a Pivot Point – Black represents the price when the report was produced