Market Wrap: Stocks, Bonds, Commodities
Wall Street closed sharply lower on Monday as investors started the holiday-shortened week in a risk-off mood, as rising bond yields weighed on market-leading growth stocks ahead of crucial inflation data.
The S&P 500 lose(1.69%) ended at 4,412.53 points, while the Nasdaq Composite down 2.18% to 13,411.96. The Dow Jones Industrial was fell 1.19% to 34,308.08.
MSCI’s index of Asia-Pacific stocks outside Japan is drop 0.08% to 700.31 levels. Australian index lower 0.42% to 7,454.00. Japanese Nikkei Index slipped 1.81% to 26,334.98.
European stocks were Negative on Tuesday, with the Stoxx Europe 50 Index lose 1.61% to 3,777.15 Germany’s DAX drop 1.70% to 13,952.55, and France’s CAC down 1.73% to 6,442.73, and U.K.’s FTSE 100 decrease 0.93% to 7,547.49.
Benchmark 10-year U.S. Treasury fell as demand for safe assets ascend again, today 10-year bond yields a positive 2.826.
Oil prices fell about 4 percent on Monday, with Brent crude tumbling below $100 a barrel on plans to release record volumes of crude and oil products from strategic stocks and on continuing coronavirus lockdowns in China
Spot Brent crude oil rose 2.56% to $100.97 per barrel. US West Texas Intermediate crude up 2.61% to $96.73 a barrel.
The yellow metal gold is advance 0.42% to 1,956.40 dollars per ounce.
Market Wrap: Forex
Japanese policymakers warned on Tuesday against any rapid moves in the foreign exchange market, underscoring the importance of stability as authorities kept a wary watch on the yen after it slumped to six-year lows against the dollar.
Today, the U.S. dollar index measures the Greenback against a trade-weighted basket of six major currencies, which is an increase of 0.19% to 100.108.
The Euro US Dollar (EUR/USD) is a widely traded pair that is negative today. This left the pair trading around $1.08690.
The Japanese yen was positive against the U.S. dollar on Tuesday as the stock up. Today USD/JPY is rose 0.10% to 125.470 level.
Another commodity-related currency positive against the U.S dollar, AUD/USD up 0.18% to 0.74320, and NZD/USD higher 0.09% to 0.68310 level.
EUR/USD Intraday: Major Resistance Level at 1.08890
Our pivot point is at 1.08890
Preferable Price Action: Take Short positions below pivot level with targets at 1.08240 & 1.07780 in extension.
Alternative Price Action: Above pivot looks for a further upside to 1.09510 & 1.09940.
Comment: RSI below 50 levels and Pair below its 20MA & 50MA.
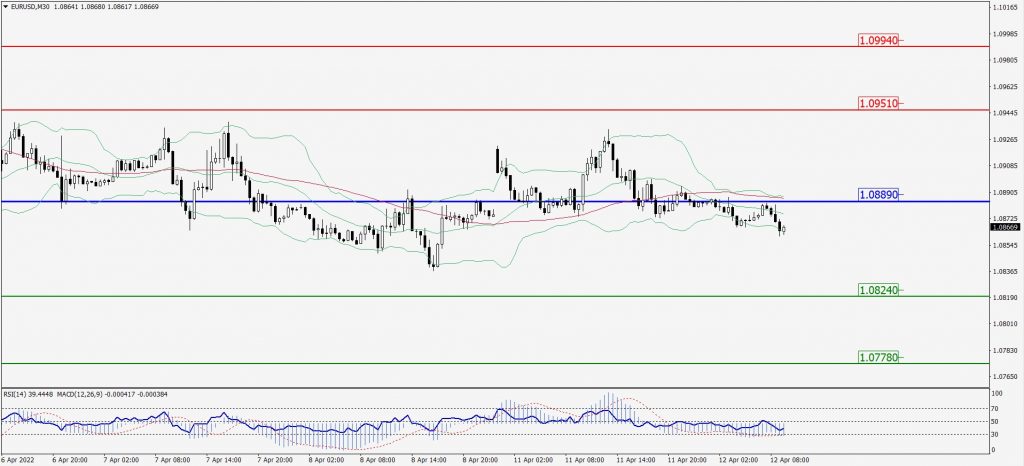
Green Lines Indicate Resistance Levels – Red Lines Indicates Support Levels
Light Blue is a Pivot Point – Black represents the price when the report was produced
GBP/USD Intraday: In a Consolidation Zone
Our pivot point is at 1.30270
Preferable Price Action: Sell positions below pivot with targets at 1.29760 & 1.29390 in extension.
Alternative Price Action: The price above pivot would call for further upside to 1.30760 & 1.31170.
Comment: RSI below 50 levels and Pair below its 20MA & 55MA.
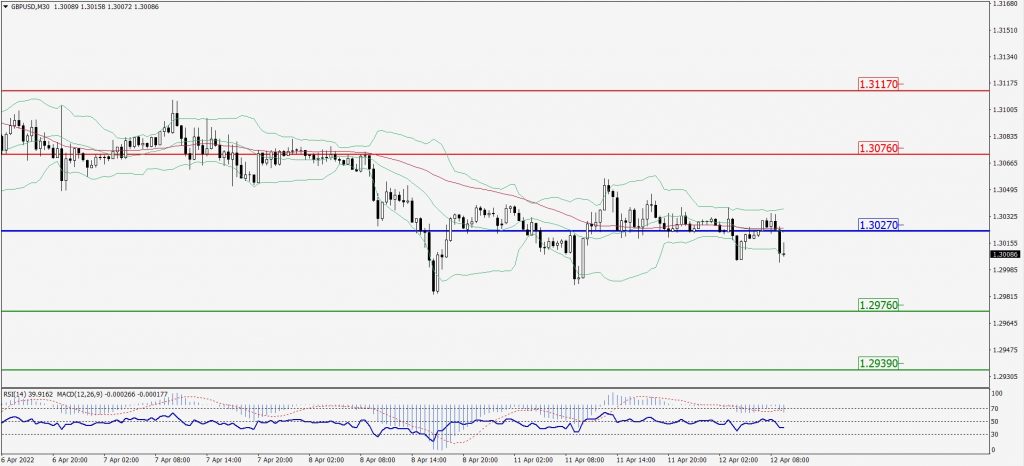
Green Lines Indicate Resistance Levels – Red Lines Indicates Support Levels
Light Blue is a Pivot Point – Black represents the price when the report was produced
USD/JPY Intraday: Trend on The Upside
Our pivot point is at 125.430
Preferable Price Action: Buy position above pivot with the target at 126.650 and 127.650 in extension.
Alternative Price Action: The downside breakout of the pivot would call for 124.390 and 123.360.
Comment: MACD in positive territory and Pair above its 20MA & 55MA.
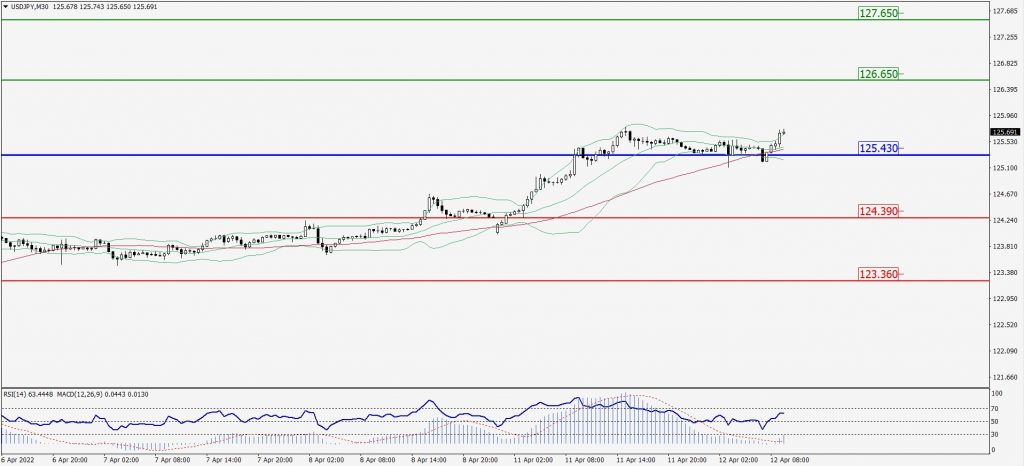
Green Lines Indicate Resistance Levels – Red Lines Indicates Support Levels
Light Blue is a Pivot Point – Black represents the price when the report was produced
AUD/USD Intraday: In a Consolidation Zone
Our pivot point is at 0.74220
Preferable Price Action: Buy Positions above pivot with targets at 0.74930 & 0.75550 in extension.
Alternative Price Action: Below pivot looks for a further downside with 0.73600 & 0.73010 as targets.
Comment: RSI above 50 levels and Pair above 20 MA.
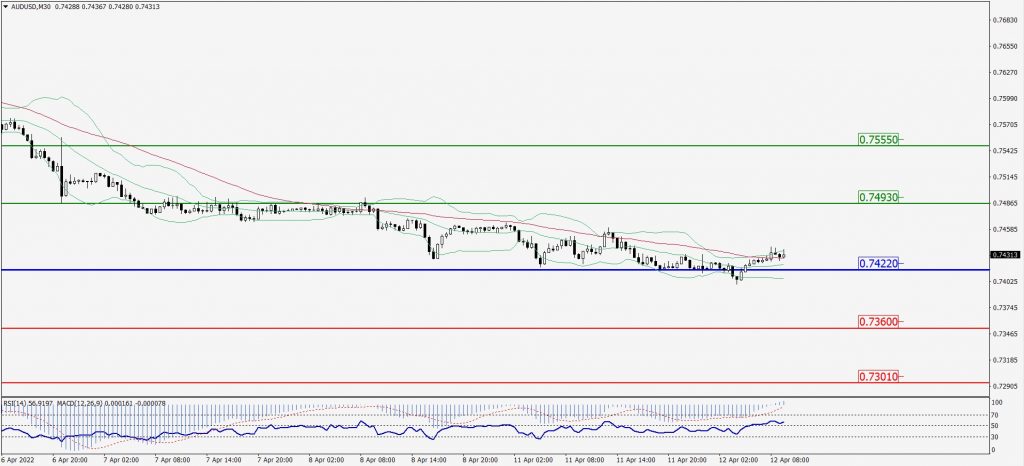
Green Lines Indicate Resistance Levels – Red Lines Indicates Support Levels
Light Blue is a Pivot Point – Black represents the price when the report was produced
CRUDEOIL Intraday: In a Consolidation Zone
Our pivot point is at 96.15
Preferable Price Action: Above pivots Buy oil with 99.50 & 102.45 as targets.
Alternative Price Action: Sell crude below pivot with targets at 93.35 and 90.50 in extension.
Comment: MACD is in the positive territory and Pair above its 20MA & 55MA.
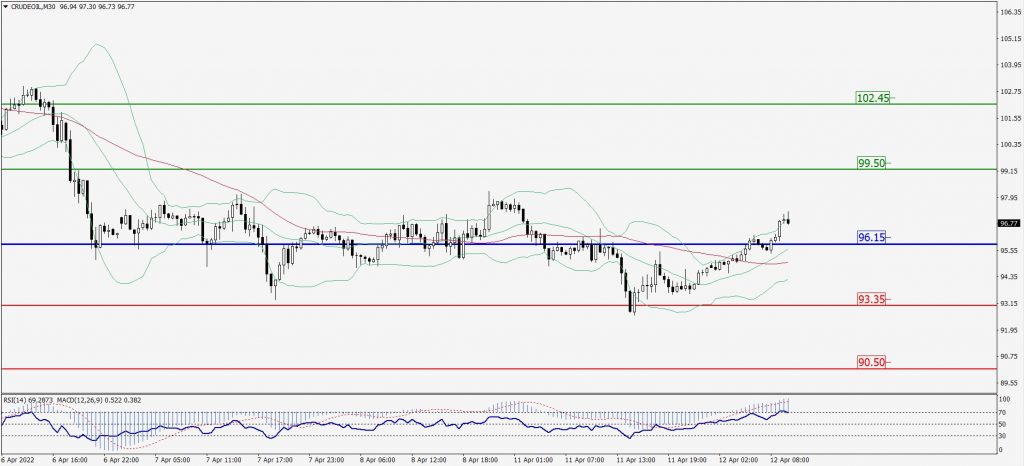
Green Lines Indicate Resistance Levels – Red Lines Indicates Support Levels
Light Blue is a Pivot Point – Black represents the price when the report was produced
XAU/USD Intraday: Major Trend on The Upside
Our pivot point is 1952.50
Preferable Price Action: Further upside to 1969.30 and 1980.40.
Alternative Price Action: If the price gives an upside breakout of a pivot, then the price extends to 1938.00 and 1926.00.
Comment: MACD is a positive territory and Pair above its 20MA & 55MA.
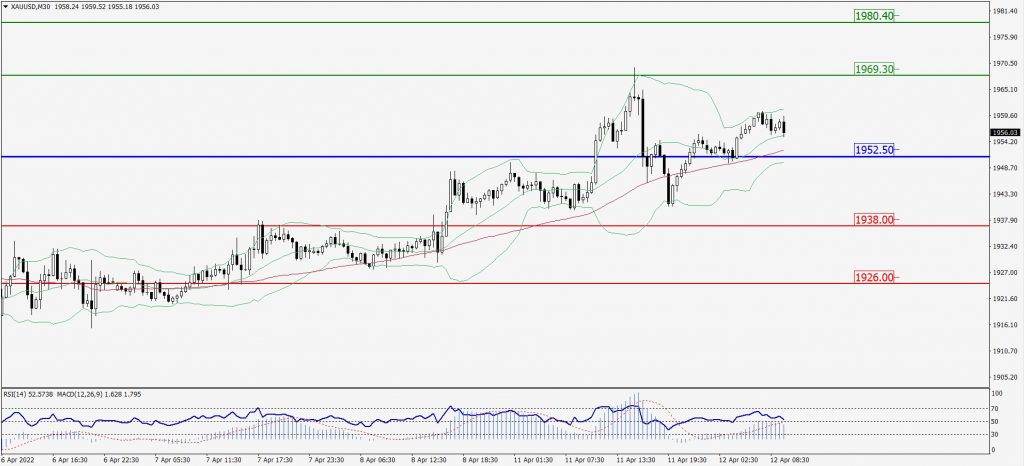
Green Lines Indicate Resistance Levels – Red Lines Indicates Support Levels
Light Blue is a Pivot Point – Black represents the price when the report was produced
Dow Jones Intraday: Trend on The Downside
Our pivot point is 34,298.00
Preferable Price Action: Take Sell positions below pivot with targets at 33,980.00 & 33,742.00.
Alternative Price Action: Above 34,298.00 looks for further upside to 34,577.00 & 34,830.00.
Comment: RSI below 50 levels and pair below its 20MA & 55MA.
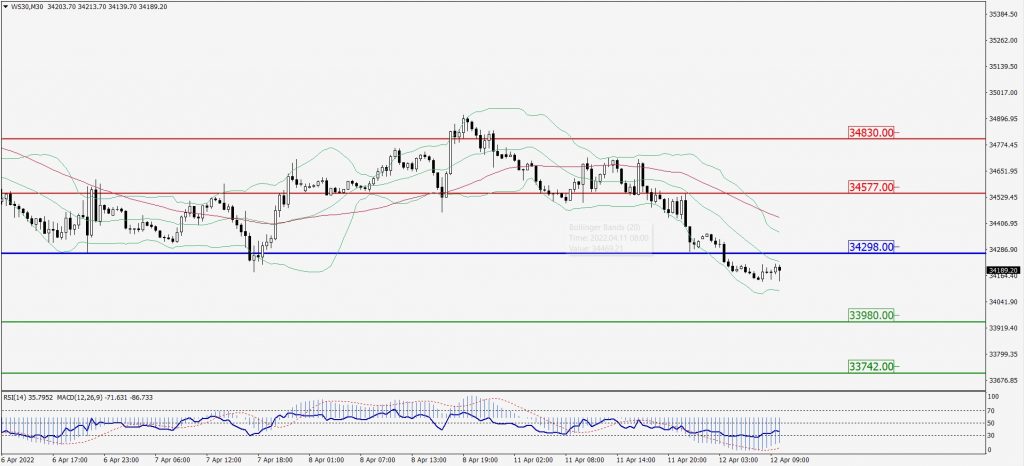
Green Lines Indicate Resistance Levels – Red Lines Indicates Support Levels
Light Blue is a Pivot Point – Black represents the price when the report was produced