Market Wrap: Stocks, Bonds, Commodities
Most Asian currencies inched higher on Wednesday as the dollar weakened ahead of a key U.S. inflation reading, while focus turned to China’s annual economic policy meeting for clues on new stimulus measures from the world’s second largest economy.
The Dow Jones Industrial Average fail 154.10 points to 44,247.83, the S&P 500 loss 0.30% to 6,034.91 and the Nasdaq Composite down 49.45 points to 19,687.24.
MSCI’s index of Asia-Pacific stocks outside Japan is down 0.63% to 722.04 levels. The Australian index was lower by 0.47% to 8,353.00. Japanese Nikkei Index increase 0.07% today.
European stocks were negative on Wednesday, with the Stoxx Europe 50 Index decrease 0.68% to 4,951.55 Germany’s DAX descend 0.08% to 20,329.16, and France’s CAC lower 1.14% to 7,394.78 and U.K.’s FTSE 100 loss 0.86% to 8,280.36.
Benchmark 10-year U.S. Treasury rose as demand for safe assets slipped again, today 10-year bond yields 0.40% to 4.2400.
Oil prices rose on Wednesday, with market participants expecting demand to rise in the world’s largest crude importer, after Beijing announced a looser monetary policy to stimulate economic growth in China.
Spot Brent crude oil increase 0.51% to $72.56 per barrel. US West Texas Intermediate crude is increase 0.54% to $68.96 a barrel.
The yellow metal gold is up 0.33% to 2,727.26 dollars per ounce.
Market Wrap: Forex
The dollar rose on Wednesday ahead of U.S. inflation data that could offer clues about the Federal Reserve’s monetary-easing path, while analysts assess the likely impact of President-elect Donald Trump’s policies when he begins his second term.
Today, the U.S. dollar index measures the Greenback against a trade-weighted basket of six major currencies, which either ascend 0.07% to 106.155.
The Euro US Dollar (EUR/USD) is a widely traded is down 0.09% today. This left the pair trading around $1.05170.
The Japanese yen was will move negative against the U.S. dollar on Wednesday. Today USD/JPY is trades pair that decrease 0.12% to the 151.76 level.
Another commodity-related currency negative against the U.S dollar, AUD/USD loss 0.30% to 0.63560, and NZD/USD decrease 0.34% to 0.57840 level.
EUR/USD Intraday: Trend on the downside
Our pivot point is at 1.05320
Preferable Price Action: Take sell positions below pivot level with targets at 1.05140 & 1.04990 in extension.
Alternative Price Action: Buy pivot looks for a further upside to 1.05510 & 1.05670.
Comment: RSI is below 50 levels and pairs below its 55MA & 20MA.
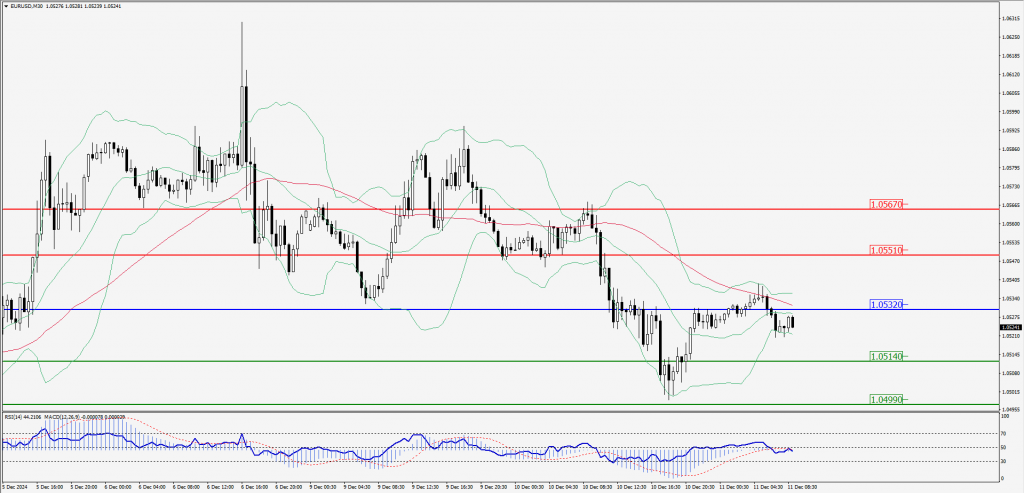
Green Lines Indicate Resistance Levels – Red Lines Indicate Support Levels
Light Blue is a Pivot Point – Black represents the price when the report was produced
GBP/USD Intraday: Trend on the downside
Our pivot point is at 1.27720
Preferable Price Action: Sell positions below pivot with targets at 1.27590 & 1.27470 in extension.
Alternative Price Action: The price above pivot would call for further upside to 1.27850 & 1.27970.
Comment: RSI is below 50 levels and pairs below its 20MA.
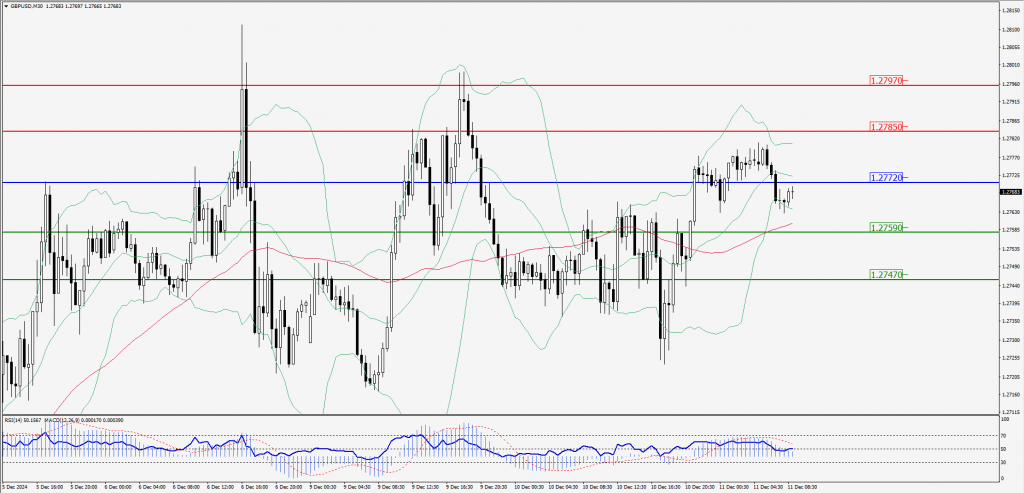
Green Lines Indicate Resistance Levels – Red Lines Indicate Support Levels
Light Blue is a Pivot Point – Black represents the price when the report was produced
USD/JPY Intraday: Trend on the upside
Our pivot point is at 151.670
Preferable Price Action: Buy position above pivot with the target at 151.980 and 152.270 in extension.
Alternative Price Action: The downside breakout of the pivot would call for 151.330 and 151.040.
Comment: MACD is above 50 levels and pairs above its 55MA.
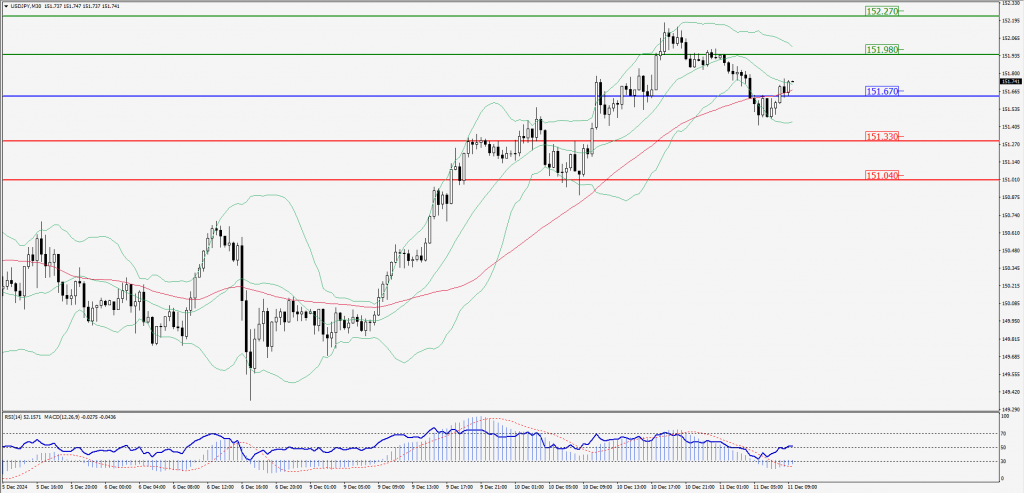
Green Lines Indicate Resistance Levels – Red Lines Indicate Support Levels
Light Blue is a Pivot Point – Black represents the price when the report was produced
AUD/USD Intraday: Trend on the downside
Our pivot point is at 0.63800
Preferable Price Action: Sell positions below pivot with targets at 0.63620 & 0.63470 in extension.
Alternative Price Action: Above pivot a further upside with 0.63990 & 0.64150 as targets.
Comment: RSI is below 50 levels and pairs below its 55MA & 20MA.
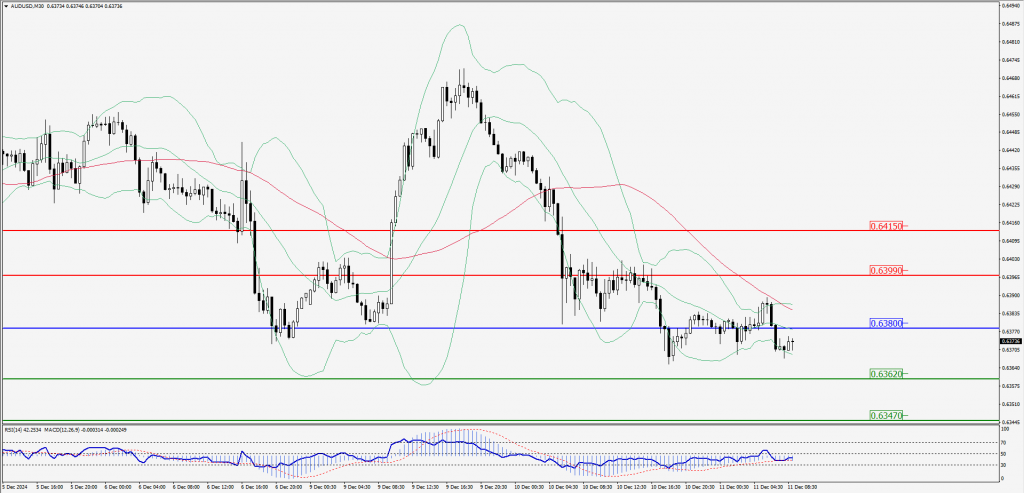
Green Lines Indicate Resistance Levels – Red Lines Indicate Support Levels
Light Blue is a Pivot Point – Black represents the price when the report was produced
CRUDEOIL Intraday: Trend on the upside
Our pivot point is at 68.78
Preferable Price Action: Above pivot buy oil with 69.17 & 69.49 as targets.
Alternative Price Action: Sell crude below pivot with targets at 68.43 & 68.09 in extension.
Comment: RSI is at above 50 levels and pairs above its 55MA & 20MA.
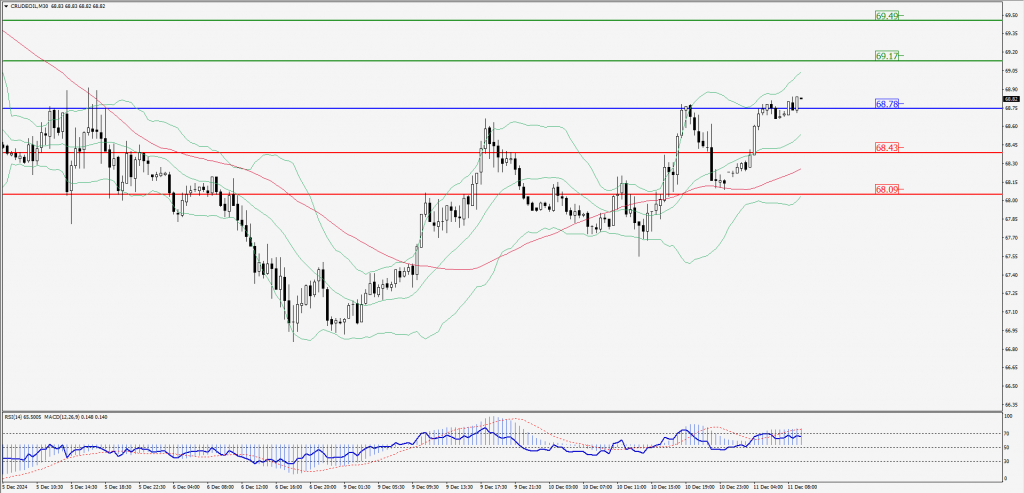
Green Lines Indicate Resistance Levels – Red Lines Indicate Support Levels
Light Blue is a Pivot Point – Black represents the price when the report was produced
XAU/USD Intraday: Trend on the upside
Our pivot point is at 2693.80
Preferable Price Action: Further upside to 2705.20 and 2716.20.
Alternative Price Action: If the price gives an downside breakout of a pivot, then the price extends to 2682.20 and 2671.60.
Comment: MACD is above 50 levels and pairs above its 55MA.
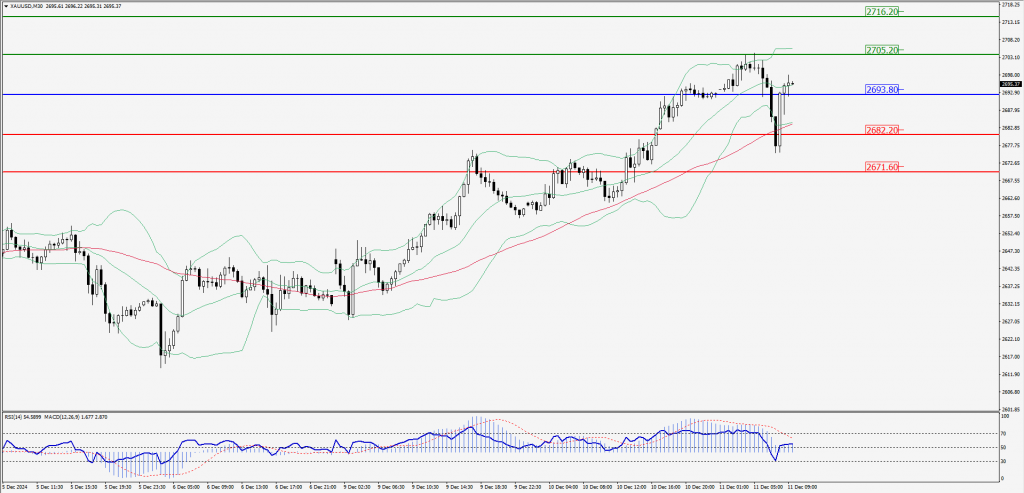
Green Lines Indicate Resistance Levels – Red Lines Indicate Support Levels
Light Blue is a Pivot Point – Black represents the price when the report was produced
Dow Jones Intraday: Trend on the downside
Our pivot point is 44,297.20
Preferable Price Action: Take sell positions below the pivot with targets at 44,176.10 & 44,077.70.
Alternative Price Action: Above 44,297.20 looks for further upside to 44,418.20 & 44,528.70.
Comment: RSI is below 50 levels and pairs below its 55MA.
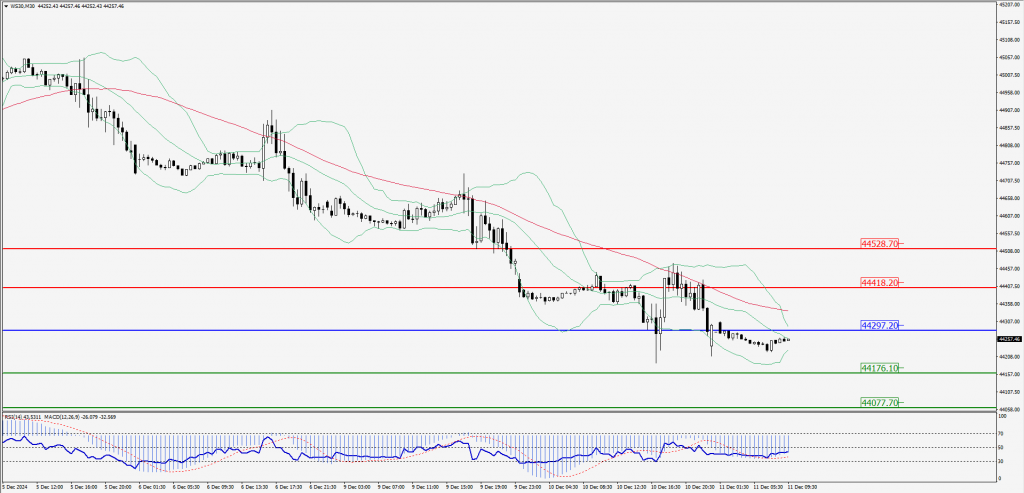
Green Lines Indicate Resistance Levels – Red Lines Indicate Support Levels
Light Blue is a Pivot Point – Black represents the price when the report was produced