Market Wrap: Stocks, Bonds, Commodities
The Dow rose and the S&P 500 ended lower in choppy trade on Friday, as beaten-down bank shares gained and investors grappled with how best to deal with an economy that could skid as the Federal Reserve moves to aggressively tackle inflation.
The S&P 500 lose(0.43%) ended at 4,488.28 points, while the Nasdaq Composite down 1.34% to 13,711.00. The Dow Jones Industrial was rose 0.40% to 34,721.12.
MSCI’s index of Asia-Pacific stocks outside Japan is drop 1.97% to 700.74 levels. Australian index higher 0.10% to 7,485.20. Japanese Nikkei Index slipped 0.61% to 26,821.52.
European stocks were Negative on Monday, with the Stoxx Europe 50 Index lose 0.23% to 3,849.35 Germany’s DAX drop 0.54% to 14,207.73, and France’s CAC up 0.50% to 6,580.73, and U.K.’s FTSE 100 decrease 0.32% to 7,645.25.
Benchmark 10-year U.S. Treasury fell as demand for safe assets ascend again, today 10-year bond yields a positive 2.746.
Oil prices slipped in early Asian trading, following the second straight weekly decline after world consumers announced plans to release crude from strategic stocks and as Chinese lockdowns continued.
Spot Brent crude oil lose 2.16% to $100.56 per barrel. US West Texas Intermediate crude down 2.33% to $95.97 a barrel.
The yellow metal gold is decline 0.07% to 1,944.30 dollars per ounce.
Market Wrap: Forex
The dollar was up on Monday morning in Asia, with the euro starting the week off strong as incumbent Emmanuel Macron led in the first round of voting in the French presidential election.
Today, the U.S. dollar index measures the Greenback against a trade-weighted basket of six major currencies, which is an increase of 0.06% to 99.812.
The Euro US Dollar (EUR/USD) is a widely traded pair that is positive today. This left the pair trading around $1.09050.
The Japanese yen was positive against the U.S. dollar on Monday as the stock up. Today USD/JPY is rose 0.70% to 125.190 level.
Another commodity-related currency negative against the U.S dollar, AUD/USD down 0.22% to 0.74380, and NZD/USD lower 0.10% to 0.68370 level.
EUR/USD Intraday: Major Resistance Level at 1.08980
Our pivot point is at 1.08980
Preferable Price Action: Take Short positions below pivot level with targets at 1.08430 & 1.07960 in extension.
Alternative Price Action: Above pivot looks for a further upside to 1.09510 & 1.10080.
Comment: RSI below 50 levels and Pair below 20MA.
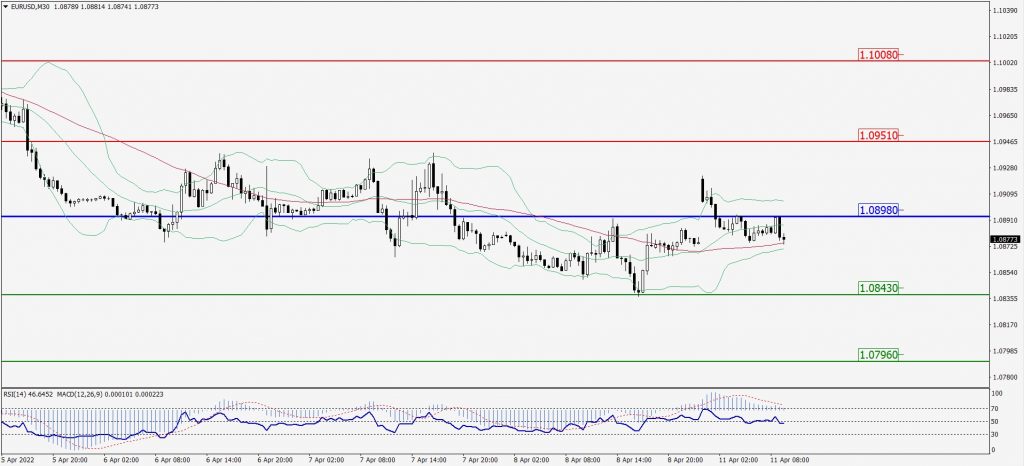
Green Lines Indicate Resistance Levels – Red Lines Indicates Support Levels
Light Blue is a Pivot Point – Black represents the price when the report was produced
GBP/USD Intraday: Trend on The Downside
Our pivot point is at 1.30290
Preferable Price Action: Sell positions below pivot with targets at 1.29400 & 1.28690 in extension.
Alternative Price Action: The price above pivot would call for further upside to 1.31120 & 1.31760.
Comment: RSI below 50 levels and Pair below its 20MA & 55MA.
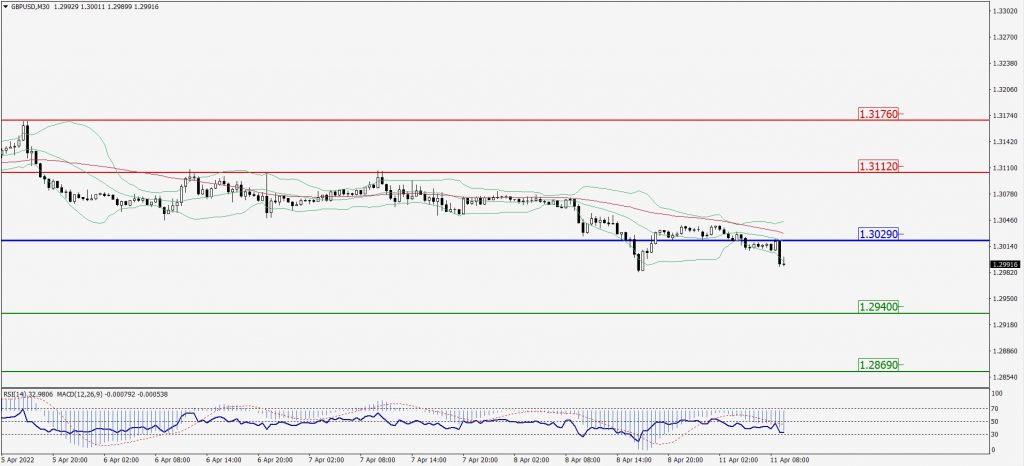
Green Lines Indicate Resistance Levels – Red Lines Indicates Support Levels
Light Blue is a Pivot Point – Black represents the price when the report was produced
USD/JPY Intraday: Trend on The Upside
Our pivot point is at 125.040
Preferable Price Action: Buy position above pivot with the target at 126.320 and 127.210 in extension.
Alternative Price Action: The downside breakout of the pivot would call for 123.900 and 122.950.
Comment: MACD in positive territory and Pair above its 20MA & 55MA.
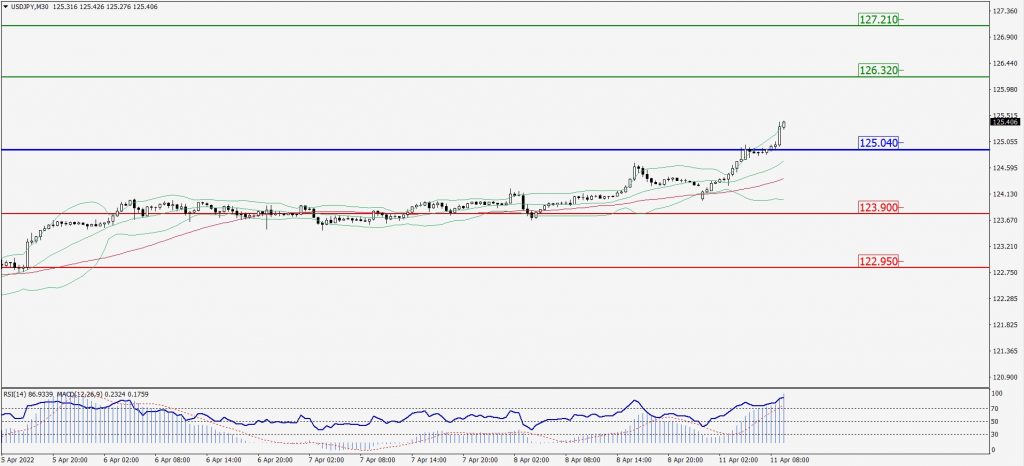
Green Lines Indicate Resistance Levels – Red Lines Indicates Support Levels
Light Blue is a Pivot Point – Black represents the price when the report was produced
AUD/USD Intraday: Trend on The Downside
Our pivot point is at 0.74750
Preferable Price Action: Sell Positions below pivot with targets at 0.73640 & 0.72730 in extension.
Alternative Price Action: Above pivot looks for a further upside with 0.75950 & 0.76980 as targets.
Comment: RSI below 50 levels and Pair below its 20 MA & 55MA.
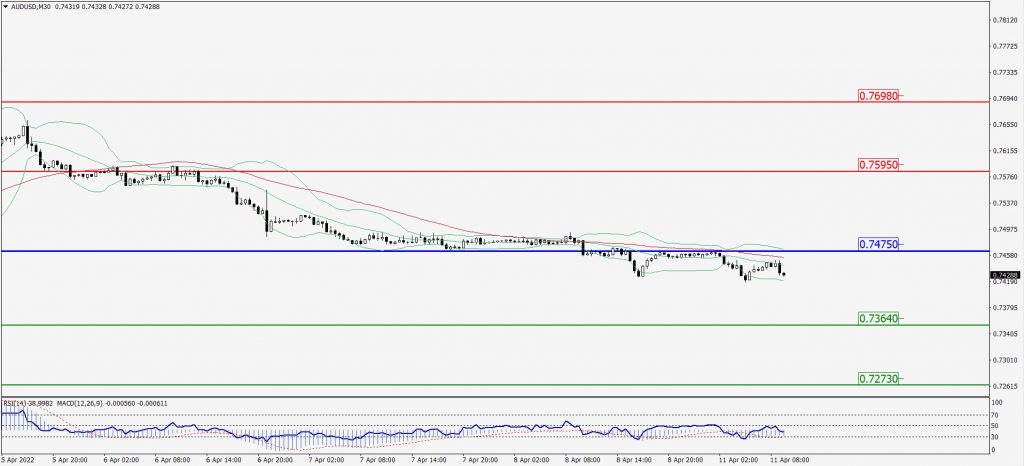
Green Lines Indicate Resistance Levels – Red Lines Indicates Support Levels
Light Blue is a Pivot Point – Black represents the price when the report was produced
CRUDEOIL Intraday: In a Consolidation Zone
Our pivot point is at 96.98
Preferable Price Action: Below pivots Sell oil with 93.70 & 90.79 as targets.
Alternative Price Action: Buy crude above pivot with targets at 99.87 and 102.09 in extension.
Comment: MACD is in the negative territory and Pair below its 20MA & 55MA.
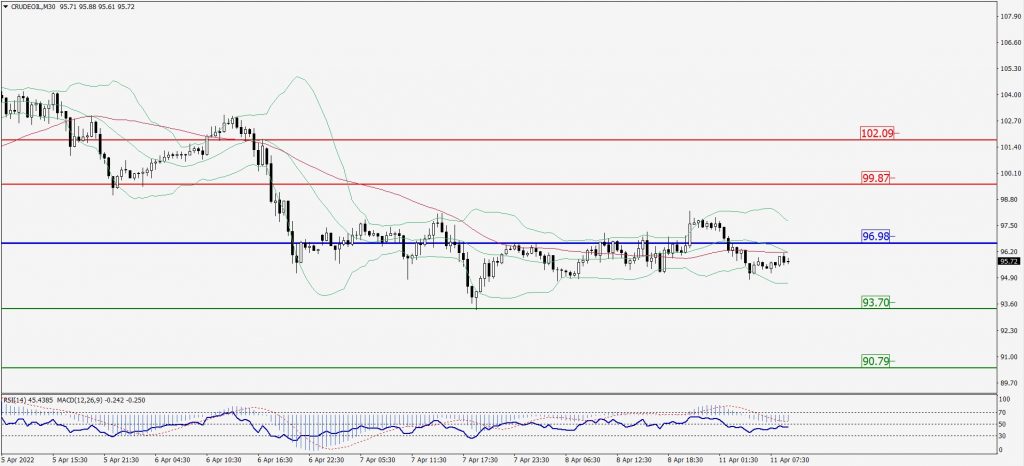
Green Lines Indicate Resistance Levels – Red Lines Indicates Support Levels
Light Blue is a Pivot Point – Black represents the price when the report was produced
XAU/USD Intraday: Major Support Level at 1940.10
Our pivot point is 1940.10
Preferable Price Action: Further upside to 1951.50 and 1959.30.
Alternative Price Action: If the price gives a downside breakout of a pivot, then the price extends to 1930.50 and 1921.70.
Comment: MACD is a flat territory and Pair above 55MA.
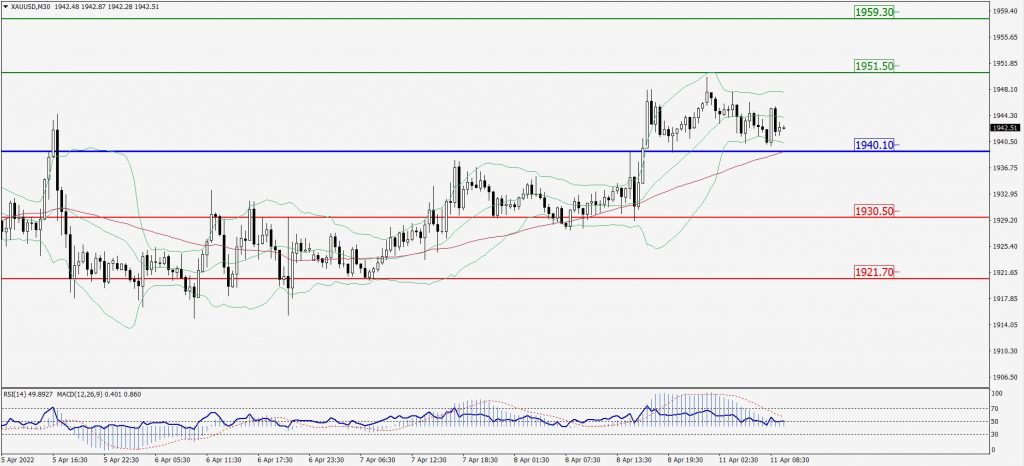
Green Lines Indicate Resistance Levels – Red Lines Indicates Support Levels
Light Blue is a Pivot Point – Black represents the price when the report was produced
Dow Jones Intraday: In a Consolidation Zone
Our pivot point is 34,714.00
Preferable Price Action: Take Sell positions below pivot with targets at 34,438.00 & 34,225.00.
Alternative Price Action: Above 34,714.00 looks for further upside to 34,943.00 & 35,128.00.
Comment: RSI below 50 levels and pair below 55MA.
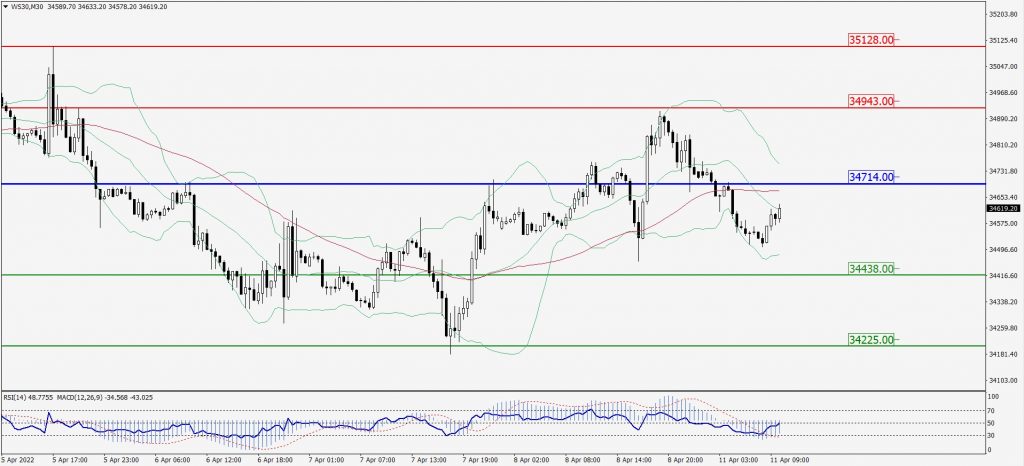
Green Lines Indicate Resistance Levels – Red Lines Indicates Support Levels
Light Blue is a Pivot Point – Black represents the price when the report was produced