Market Wrap: Stocks, Bonds, Commodities
Most Asian currencies firmed slightly on Friday, while the dollar fell from near two-month highs even as hot consumer inflation data furthered bets on a smaller interest rate cut by the Federal Reserve.
The Dow Jones Industrial Average fail 57.88 points to 42,454.12, the S&P 500 loss 0.21% to 5,780.05 and the Nasdaq Composite descend 9.57 points to 18,282.05.
MSCI’s index of Asia-Pacific stocks outside Japan is up 1.07% to 756.71 levels. The Australian index was lower by 0.10% to 8,214.50. Japanese Nikkei Index increase 0.42% today.
European stocks were negative on Friday, with the Stoxx Europe 50 Index decrease 0.26% to 4,957.65 Germany’s DAX descend 0.13% to 19,185.45, and France’s CAC lower 0.42% to 7,510.22 and U.K.’s FTSE 100 loss 0.14% to 8,226.27.
Benchmark 10-year U.S. Treasury fail as demand for safe assets slipped again, today 10-year bond yields 0.52% to 4.0770.
Oil retreated on Friday after settling higher the previous day, but prices remained set for a second weekly gain as investors weighed the impact of hurricane damage on U.S. demand against any broad supply disruption if Israel attacks Iranian oil sites.
Spot Brent crude oil increase 2.43% to $78.44 per barrel. US West Texas Intermediate crude is increase 2.31% to $74.93 a barrel.
The yellow metal gold is up 1.19% to 2,657.20 dollars per ounce.
Market Wrap: Forex
The U.S. dollar slipped against the yen on Friday as investors weighed data showing labor market weakness as well as a slight uptick in consumer prices, suggesting that the Federal Reserve will likely continue cutting interest rates.
Today, the U.S. dollar index measures the Greenback against a trade-weighted basket of six major currencies, which increase 0.01% to 102.697.
The Euro US Dollar (EUR/USD) is a widely traded is up 0.01% today. This left the pair trading around $1.09360.
The Japanese yen was will move positive against the U.S. dollar on Thursday. Today USD/JPY is trades pair that increase 0.14% to the 148.770 level.
Another commodity-related currency mixed against the U.S dollar, AUD/USD loss 0.10% to 0.67330, and NZD/USD increase 0.01% to 0.60920 level.
EUR/USD Intraday: Trend on the upside
Our pivot point is at 1.09340
Preferable Price Action: Take buy positions above pivot level with targets at 1.09480 & 1.09610 in extension.
Alternative Price Action: Sell pivot looks for a further downside to 1.09200 & 1.09070.
Comment: RSI is above 50 levels and pairs above its 55MA.
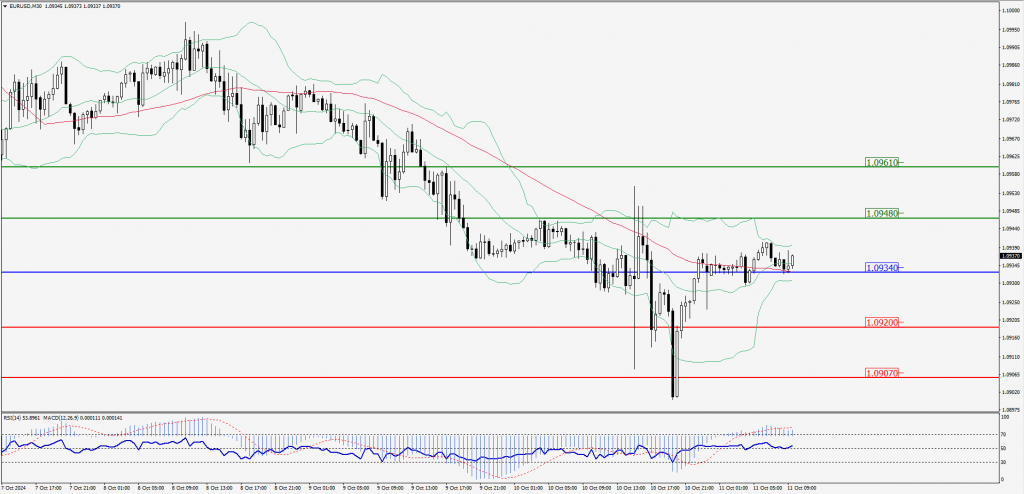
Green Lines Indicate Resistance Levels – Red Lines Indicate Support Levels
Light Blue is a Pivot Point – Black represents the price when the report was produced
GBP/USD Intraday: Trend on the downside
Our pivot point is at 1.30500
Preferable Price Action: Sell positions below pivot with targets at 1.30380 & 1.30260 in extension.
Alternative Price Action: The price above pivot would call for further upside to 1.30620 & 1.30730.
Comment: RSI is below 50 levels and pairs below its 20MA & 55MA.
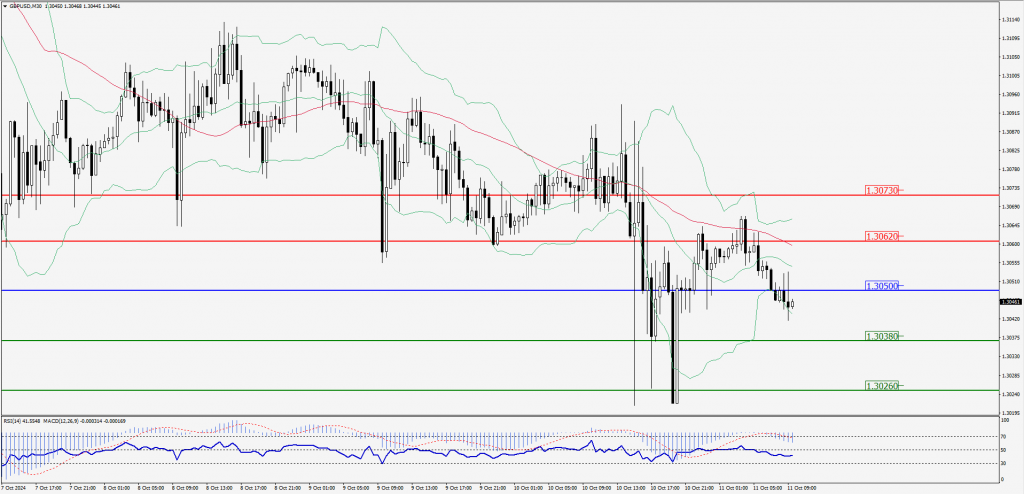
Green Lines Indicate Resistance Levels – Red Lines Indicate Support Levels
Light Blue is a Pivot Point – Black represents the price when the report was produced
USD/JPY Intraday: Trend on the upside
Our pivot point is at 148.630
Preferable Price Action: Buy position above pivot with the target at 148.950 and 149.230 in extension.
Alternative Price Action: The downside breakout of the pivot would call for 148.330 and 148.050.
Comment: MACD is above 50 levels.
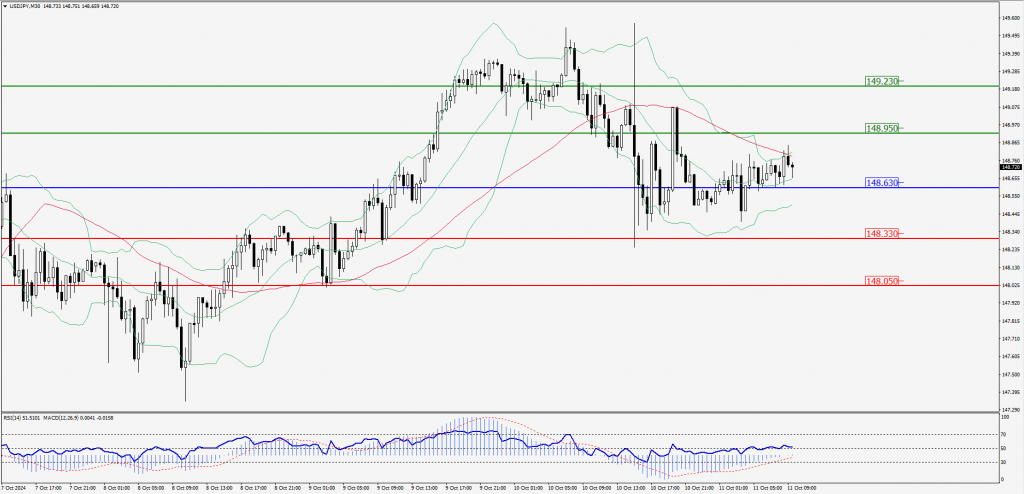
Green Lines Indicate Resistance Levels – Red Lines Indicate Support Levels
Light Blue is a Pivot Point – Black represents the price when the report was produced
AUD/USD Intraday: Resistance level at 0.67370
Our pivot point is at 0.67370
Preferable Price Action: Sell positions below pivot with targets at 0.67230 & 0.67100 in extension.
Alternative Price Action: Above pivot a further upside with 0.67510 & 0.67630 as targets.
Comment: RSI is below 50 levels and pairs below its 20MA.
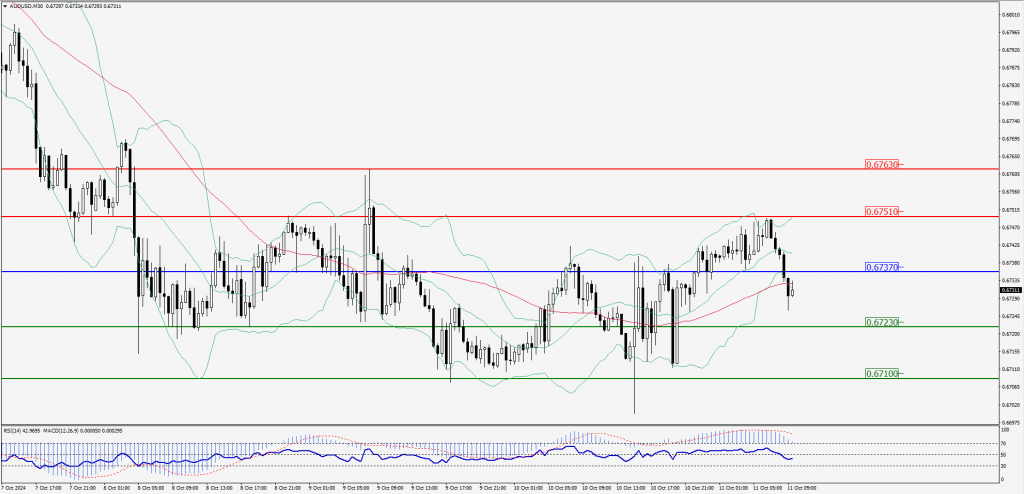
Green Lines Indicate Resistance Levels – Red Lines Indicate Support Levels
Light Blue is a Pivot Point – Black represents the price when the report was produced
CRUDEOIL Intraday: Trend on the downside
Our pivot point is at 74.67
Preferable Price Action: Below pivot sell oil with 73.89 & 73.16 as targets.
Alternative Price Action: Buy crude above pivot with targets at 75.46 & 76.21 in extension.
Comment: RSI is at below 50 levels and pairs below its 20MA.
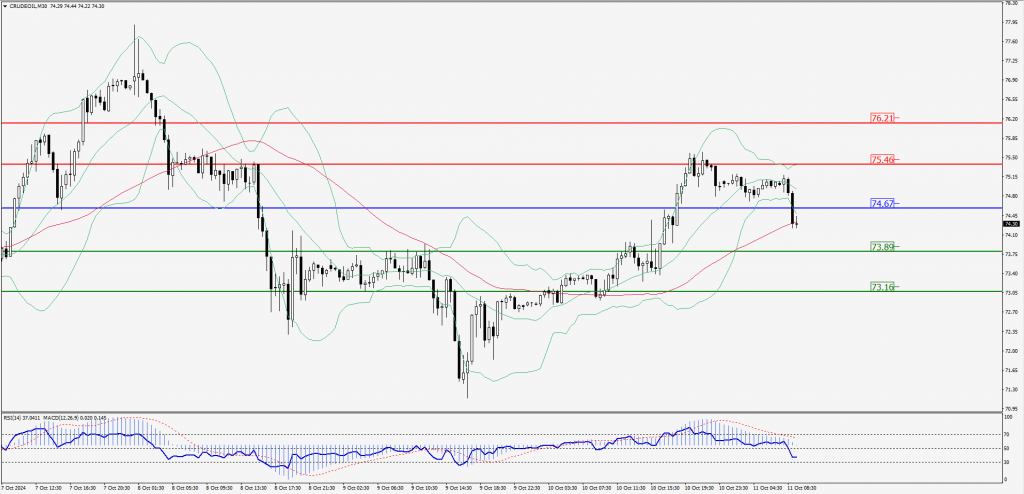
Green Lines Indicate Resistance Levels – Red Lines Indicate Support Levels
Light Blue is a Pivot Point – Black represents the price when the report was produced
XAU/USD Intraday: Trend on the upside
Our pivot point is at 2637.50
Preferable Price Action: Further upside to 2645.60 and 2653.20.
Alternative Price Action: If the price gives an downside breakout of a pivot, then the price extends to 2629.50 and 2621.90.
Comment: MACD is above 50 levels and pairs above its 55MA.
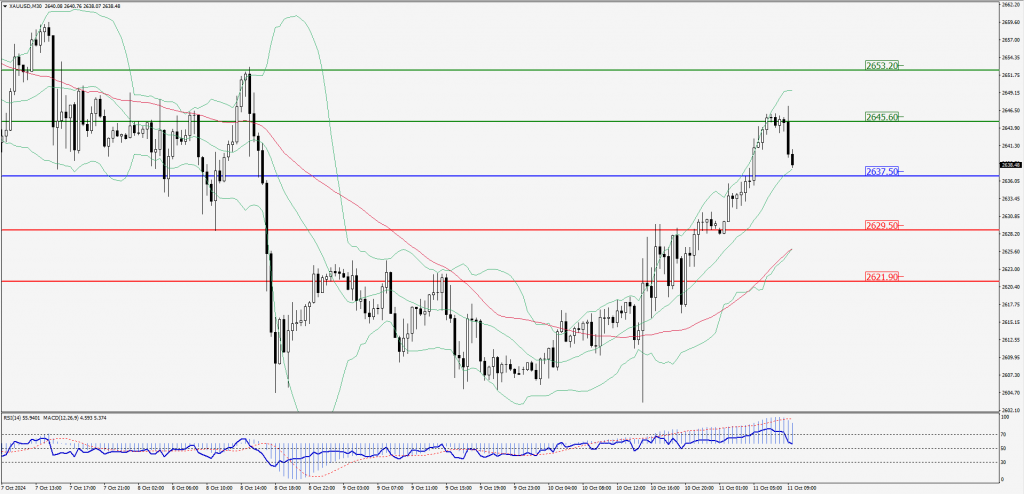
Green Lines Indicate Resistance Levels – Red Lines Indicate Support Levels
Light Blue is a Pivot Point – Black represents the price when the report was produced
Dow Jones Intraday: Trend on the downside
Our pivot point is 42,492.00
Preferable Price Action: Take sell positions below the pivot with targets at 42,390.70 & 42,286.60.
Alternative Price Action: Above 42,492.00 looks for further upside to 42,596.10 & 42,692.50.
Comment: RSI is below 50 levels and pairs below its 55MA & 20MA.
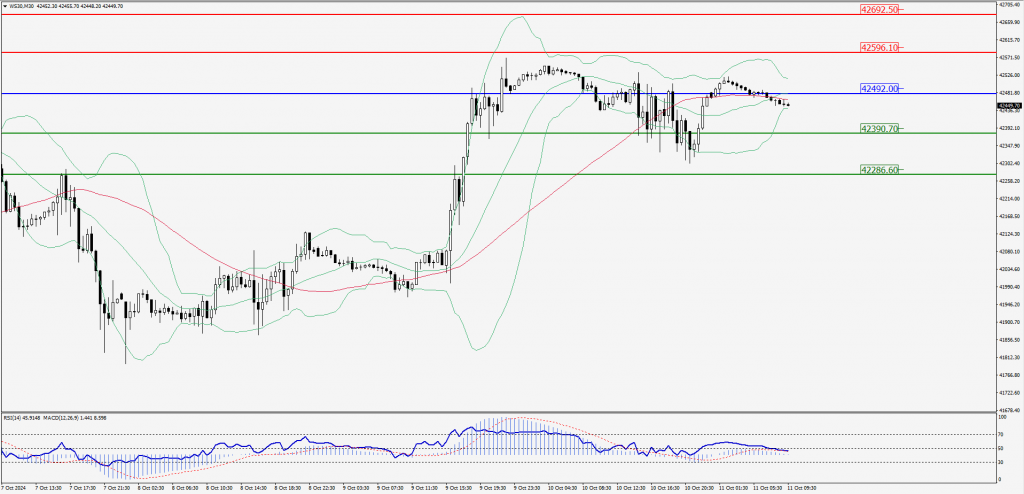
Green Lines Indicate Resistance Levels – Red Lines Indicate Support Levels
Light Blue is a Pivot Point – Black represents the price when the report was produced