Market Wrap: Stocks, Bonds, Commodities
Most Asian currencies firmed slightly on Thursday, recovering a measure of recent losses, while the dollar steadied near a seven-week peak ahead of key consumer inflation data.
The Dow Jones Industrial Average rose 431.63 points to 42,512.00, the S&P 500 gain 0.71% to 5,792.04 and the Nasdaq Composite ascend 108.70 points to 18,291.62.
MSCI’s index of Asia-Pacific stocks outside Japan is up 0.22% to 755.26 levels. The Australian index was higher by 0.43% to 8,223.00. Japanese Nikkei Index increase 0.29% today.
European stocks were negative on Thursday, with the Stoxx Europe 50 Index decrease 0.12% to 4,976.55 Germany’s DAX descend 0.12% to 19,234.35, and France’s CAC lower 0.15% to 7,548.72 and U.K.’s FTSE 100 loss 0.25% to 8,264.00.
Benchmark 10-year U.S. Treasury rose as demand for safe assets slipped again, today 10-year bond yields 0.22% to 4.0780.
Oil prices rose on Thursday underpinned by a spike in fuel demand as a major storm barrelled into Florida and concerns about potential supply disruptions in the Middle East amid heightened tensions between Israel and major oil producer Iran.
Spot Brent crude oil increase 0.38% to $76.87 per barrel. US West Texas Intermediate crude is increase 0.42% to $73.55 a barrel.
The yellow metal gold is up 0.10% to 2,628.70 dollars per ounce.
Market Wrap: Forex
The U.S. dollar rose to a 10-week peak against the yen on Thursday as markets grew more confident about a patient approach by the Federal Reserve to further monetary easing, even as a key inflation report loomed later in the day.
Today, the U.S. dollar index measures the Greenback against a trade-weighted basket of six major currencies, which decrease 0.03% to 102.660.
The Euro US Dollar (EUR/USD) is a widely traded is down 0.01% today. This left the pair trading around $1.09380.
The Japanese yen was will move negative against the U.S. dollar on Thursday. Today USD/JPY is trades pair that decrease 0.17% to the 149.030 level.
Another commodity-related currency positive against the U.S dollar, AUD/USD gain 0.20% to 0.67310, and NZD/USD increase 0.32% to 0.60820 level.
EUR/USD Intraday: Trend on the downside
Our pivot point is at 1.09470
Preferable Price Action: Take sell positions below pivot level with targets at 1.09320 & 1.09170 in extension.
Alternative Price Action: Buy pivot looks for a further upside to 1.09630 & 1.09770.
Comment: RSI is below 50 levels and pairs below its 55MA.
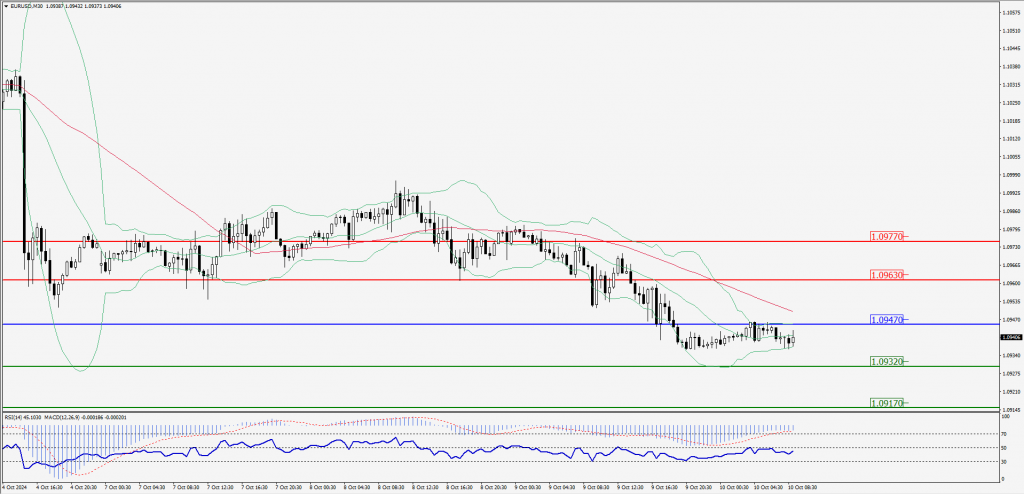
Green Lines Indicate Resistance Levels – Red Lines Indicate Support Levels
Light Blue is a Pivot Point – Black represents the price when the report was produced
GBP/USD Intraday: Trend on the upside
Our pivot point is at 1.30770
Preferable Price Action: Buy positions above pivot with targets at 1.30910 & 1.31050 in extension.
Alternative Price Action: The price below pivot would call for further downside to 1.30630 & 1.30500.
Comment: RSI is above 50 levels.
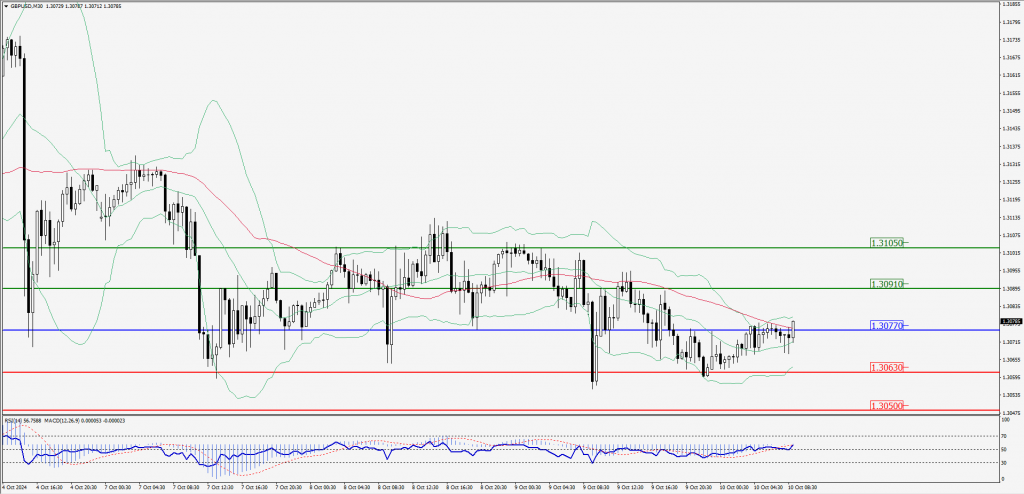
Green Lines Indicate Resistance Levels – Red Lines Indicate Support Levels
Light Blue is a Pivot Point – Black represents the price when the report was produced
USD/JPY Intraday: Trend on the downside
Our pivot point is at 149.300
Preferable Price Action: Sell position below pivot with the target at 148.960 and 148.640 in extension.
Alternative Price Action: The upside breakout of the pivot would call for 149.650 and 149.970.
Comment: MACD is below 50 levels.
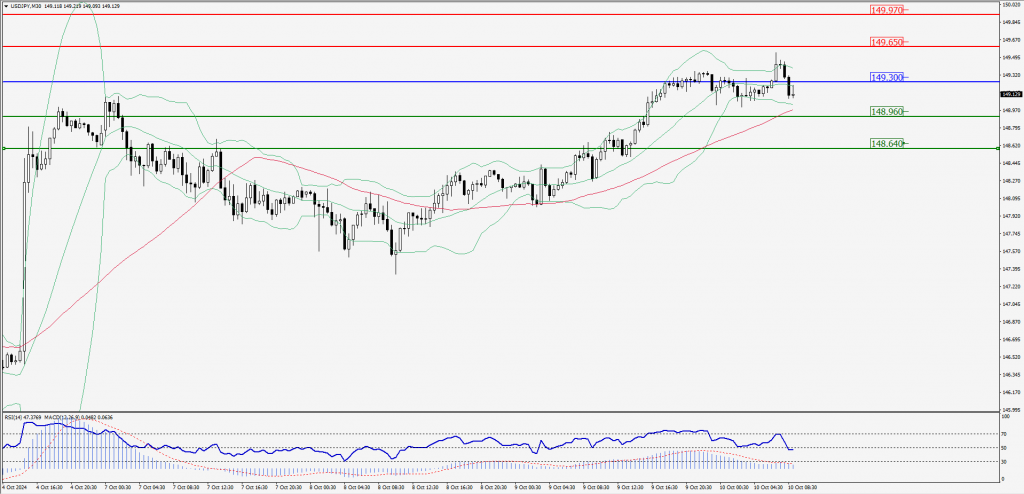
Green Lines Indicate Resistance Levels – Red Lines Indicate Support Levels
Light Blue is a Pivot Point – Black represents the price when the report was produced
AUD/USD Intraday: Trend on the upside
Our pivot point is at 0.67310
Preferable Price Action: Buy positions above pivot with targets at 0.67500 & 0.67680 in extension.
Alternative Price Action: Below pivot a further downside with 0.67120 & 0.66950 as targets.
Comment: RSI is above 50 levels and pairs below its 20MA.
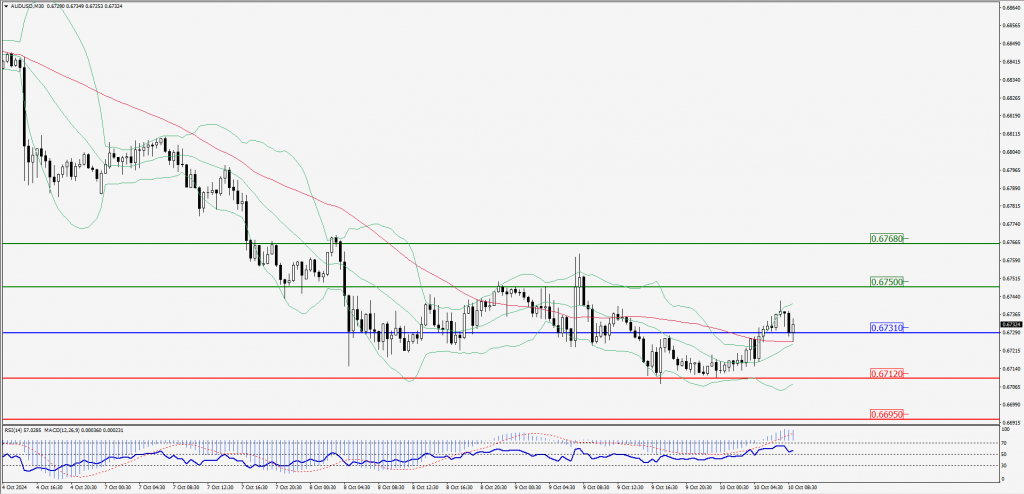
Green Lines Indicate Resistance Levels – Red Lines Indicate Support Levels
Light Blue is a Pivot Point – Black represents the price when the report was produced
CRUDEOIL Intraday: Trend on the downside
Our pivot point is at 73.25
Preferable Price Action: Below pivot sell oil with 72.43 & 71.67 as targets.
Alternative Price Action: Buy crude above pivot with targets at 74.06 & 74.84 in extension.
Comment: RSI is at below 50 levels and pairs below its 55MA & 20MA.
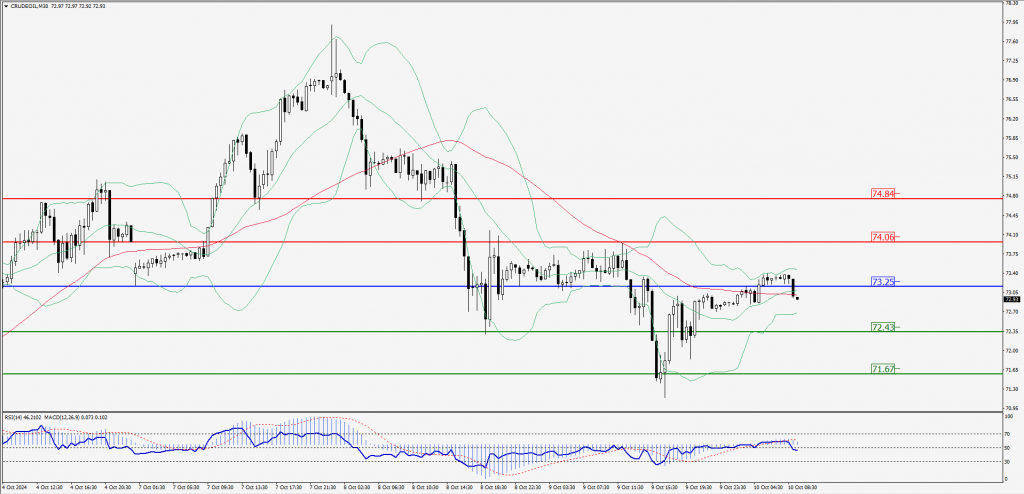
Green Lines Indicate Resistance Levels – Red Lines Indicate Support Levels
Light Blue is a Pivot Point – Black represents the price when the report was produced
XAU/USD Intraday: Trend on the downside
Our pivot point is at 2615.80
Preferable Price Action: Further downside to 2606.60 and 2598.20.
Alternative Price Action: If the price gives an upside breakout of a pivot, then the price extends to 2625.40 and 2633.90.
Comment: MACD is below 50 levels and pairs below its 55MA.
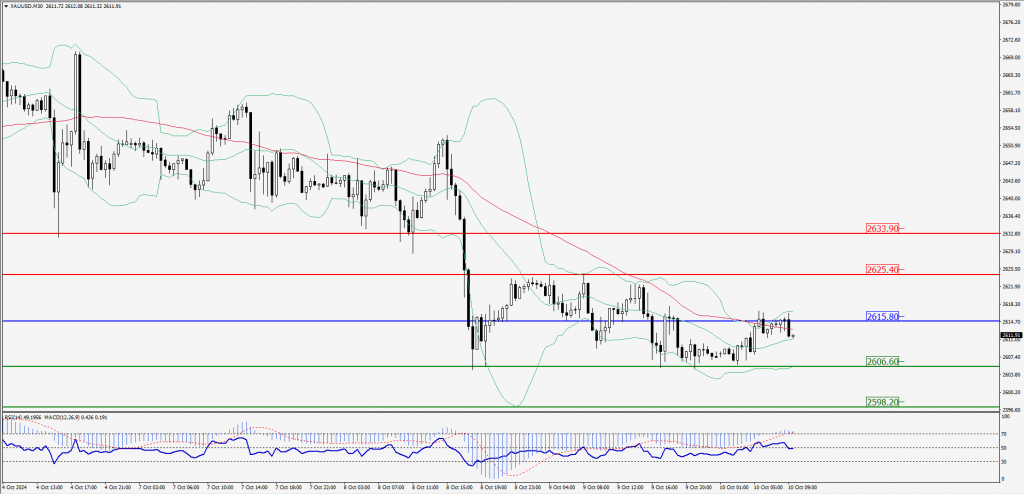
Green Lines Indicate Resistance Levels – Red Lines Indicate Support Levels
Light Blue is a Pivot Point – Black represents the price when the report was produced
Dow Jones Intraday: Trend on the upside
Our pivot point is 42,485.10
Preferable Price Action: Take buy positions above the pivot with targets at 42,583.20 & 42,659.60.
Alternative Price Action: Below 42,485.10 looks for further downside to 42,385.70 & 42,306.70.
Comment: RSI is above 50 levels and pairs above its 55MA.
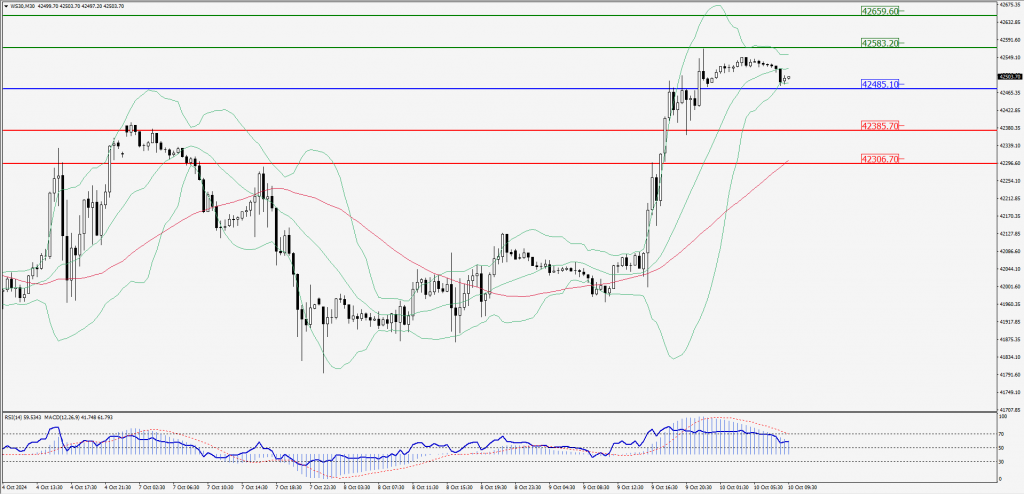
Green Lines Indicate Resistance Levels – Red Lines Indicate Support Levels
Light Blue is a Pivot Point – Black represents the price when the report was produced