Market Wrap: Stocks, Bonds, Commodities
Most Asian currencies moved little on Monday as traders digested middling cues from China on its plans for fiscal stimulus, while the yuan softened following weaker-than-expected inflation data.
The Dow Jones Industrial Average rose 409.74 points to 42,863.86, the S&P 500 gain 0.61% to 5,815.03 and the Nasdaq Composite ascend 60.89 points to 18,342.94.
MSCI’s index of Asia-Pacific stocks outside Japan is up 0.30% to 757.49 levels. The Australian index was higher by 0.47% to 8,252.80. Japanese Nikkei Index increase 0.57% today.
European stocks were mixed on Monday, with the Stoxx Europe 50 Index increase 0.03% to 5,005.55 Germany’s DAX ascend 0.36% to 19,426.15, and France’s CAC lower 0.17% to 7,564.95 and U.K.’s FTSE 100 loss 0.18% to 8,238.75.
Benchmark 10-year U.S. Treasury rose as demand for safe assets slipped again, today 10-year bond yields 0.64% to 4.0980.
Oil prices fell on Monday after data showed China’s inflation rate declined and a lack of clarity on the country’s economic stimulus plans stoked fears about fuel demand in the world’s biggest crude importer.
Spot Brent crude oil increase 1.61% to $77.77 per barrel. US West Texas Intermediate crude is decrease 1.64% to $74.32 a barrel.
The yellow metal gold is up 0.17% to 2,680.90 dollars per ounce.
Market Wrap: Forex
The dollar held onto its gains and even extended some in Asian trading on Monday as a holiday in Japan sapped liquidity, leaving China’s somewhat disappointing weekend stimulus announcements the focus of market attention.
Today, the U.S. dollar index measures the Greenback against a trade-weighted basket of six major currencies, which increase 0.13% to 102.814.
The Euro US Dollar (EUR/USD) is a widely traded is down 0.11% today. This left the pair trading around $1.09240.
The Japanese yen was will move positive against the U.S. dollar on Monday. Today USD/JPY is trades pair that increase 0.10% to the 149.280 level.
Another commodity-related currency negative against the U.S dollar, AUD/USD loss 0.22% to 0.67350, and NZD/USD decrease 0.22% to 0.60960 level.
EUR/USD Intraday: Trend on the downside
Our pivot point is at 1.09320
Preferable Price Action: Take sell positions below pivot level with targets at 1.09180 & 1.09050 in extension.
Alternative Price Action: Buy pivot looks for a further upside to 1.09460 & 1.09590.
Comment: RSI is below 50 levels and pairs below its 55MA.
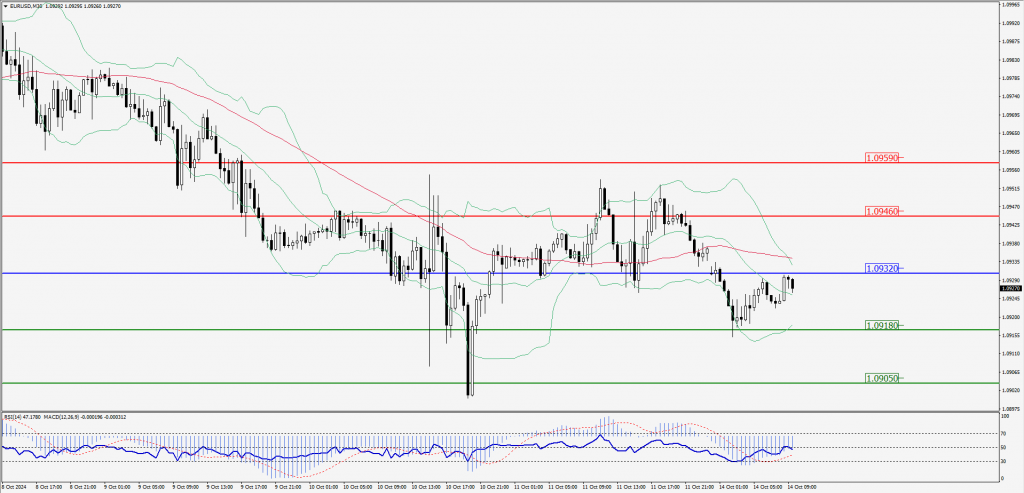
Green Lines Indicate Resistance Levels – Red Lines Indicate Support Levels
Light Blue is a Pivot Point – Black represents the price when the report was produced
GBP/USD Intraday: Trend on the upside
Our pivot point is at 1.30660
Preferable Price Action: Buy positions above pivot with targets at 1.30790 & 1.30910 in extension.
Alternative Price Action: The price below pivot would call for further downside to 1.30540 & 1.30420.
Comment: RSI is above 50 levels and pairs above its 20MA & 55MA.
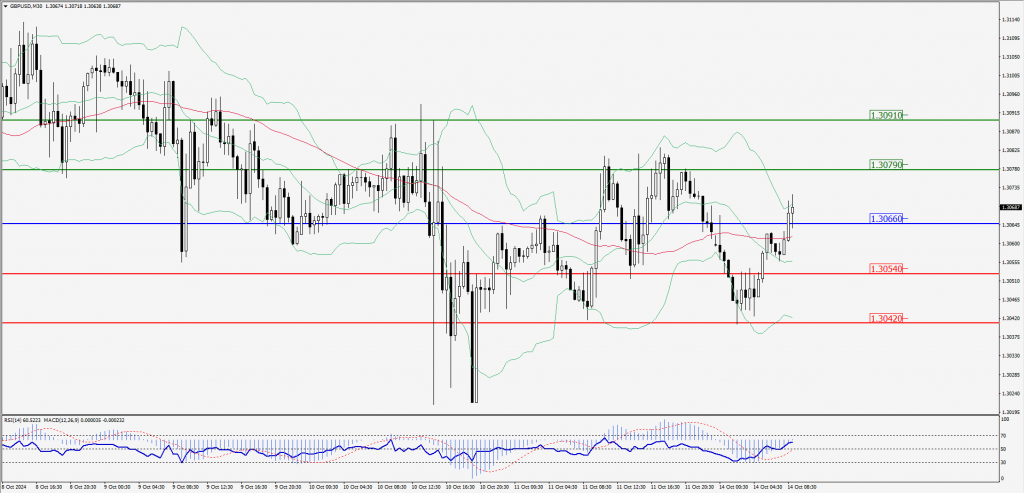
Green Lines Indicate Resistance Levels – Red Lines Indicate Support Levels
Light Blue is a Pivot Point – Black represents the price when the report was produced
USD/JPY Intraday: Trend on the upside
Our pivot point is at 149.180
Preferable Price Action: Buy position above pivot with the target at 149.400 and 149.610 in extension.
Alternative Price Action: The downside breakout of the pivot would call for 148.960 and 148.760.
Comment: MACD is above 50 levels and pairs above its 55MA.
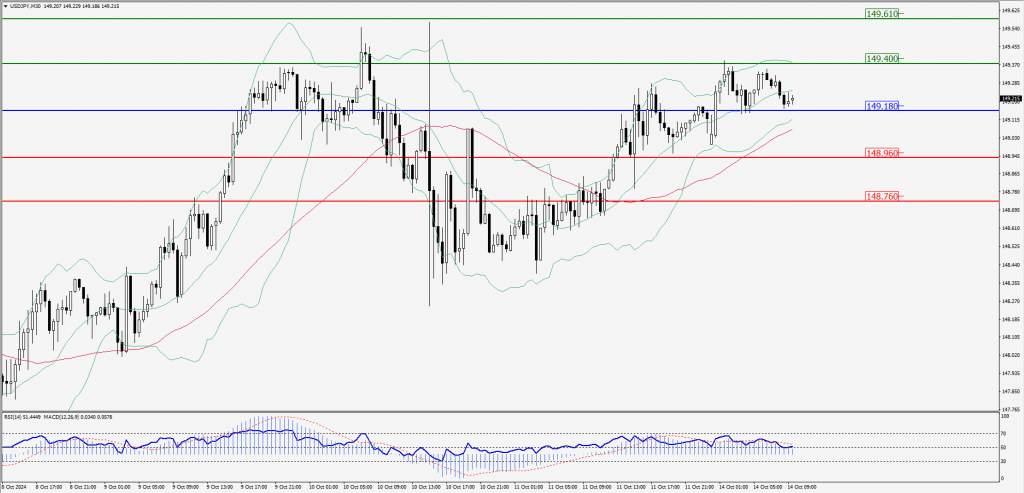
Green Lines Indicate Resistance Levels – Red Lines Indicate Support Levels
Light Blue is a Pivot Point – Black represents the price when the report was produced
AUD/USD Intraday: Resistance level at 0.67400
Our pivot point is at 0.67400
Preferable Price Action: Sell positions below pivot with targets at 0.67320 & 0.67250 in extension.
Alternative Price Action: Above pivot a further upside with 0.67480 & 0.67550 as targets.
Comment: RSI is below 50 levels and pairs below its 55MA.
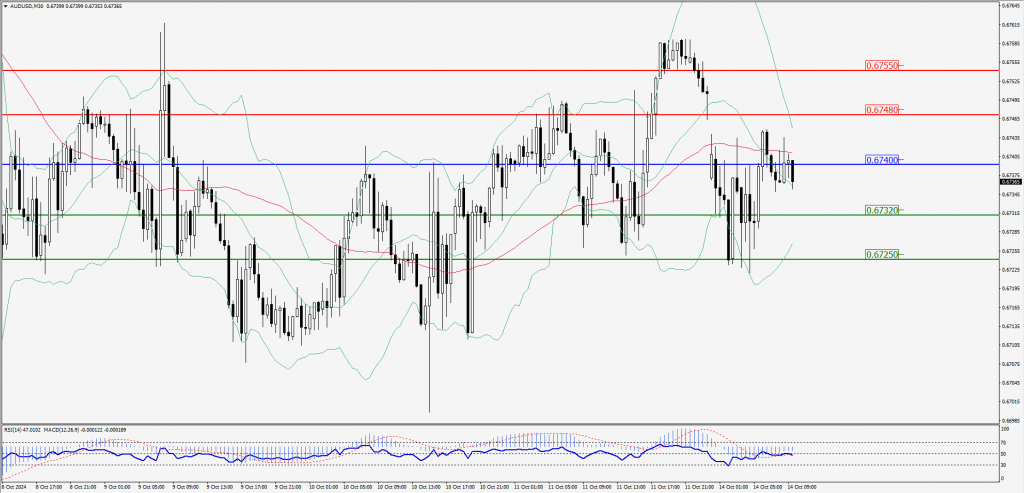
Green Lines Indicate Resistance Levels – Red Lines Indicate Support Levels
Light Blue is a Pivot Point – Black represents the price when the report was produced
CRUDEOIL Intraday: Trend on the downside
Our pivot point is at 74.19
Preferable Price Action: Below pivot sell oil with 73.61 & 73.09 as targets.
Alternative Price Action: Buy crude above pivot with targets at 74.76 & 75.31 in extension.
Comment: RSI is at below 50 levels and pairs below its 55MA.
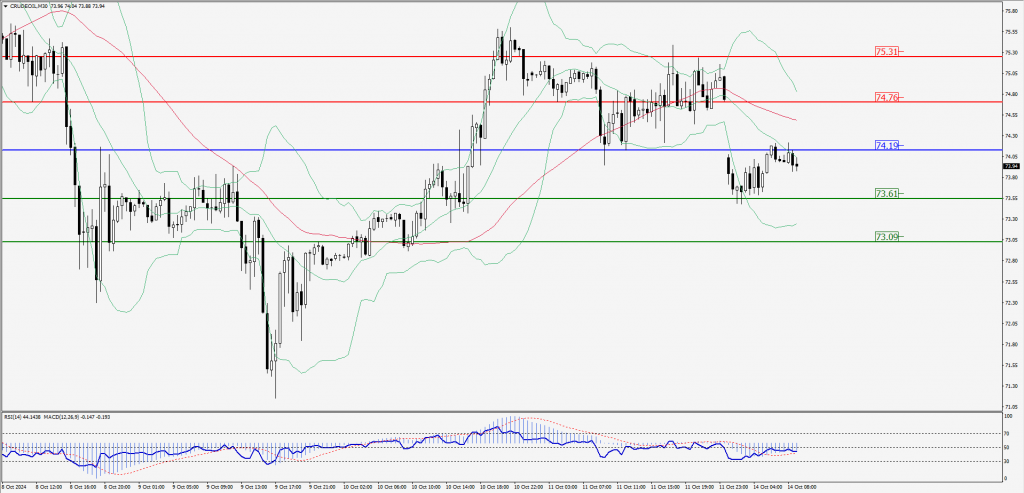
Green Lines Indicate Resistance Levels – Red Lines Indicate Support Levels
Light Blue is a Pivot Point – Black represents the price when the report was produced
XAU/USD Intraday: Trend on the upside
Our pivot point is at 2662.10
Preferable Price Action: Further upside to 2670.90 and 2678.10.
Alternative Price Action: If the price gives an downside breakout of a pivot, then the price extends to 2653.80 and 2645.70.
Comment: MACD is above 50 levels and pairs above its 55MA.
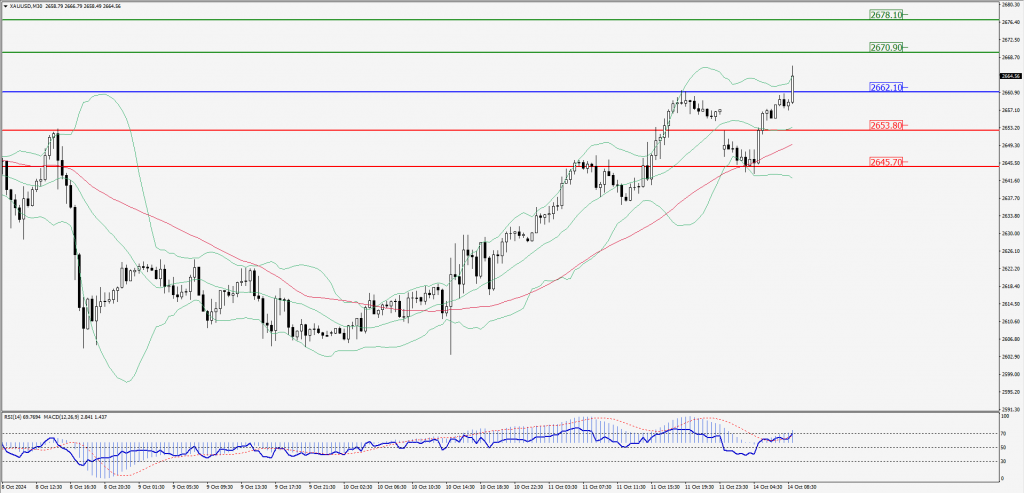
Green Lines Indicate Resistance Levels – Red Lines Indicate Support Levels
Light Blue is a Pivot Point – Black represents the price when the report was produced
Dow Jones Intraday: Trend on the upside
Our pivot point is 42,828.40
Preferable Price Action: Take buy positions above the pivot with targets at 43,000.30 & 43,172.20.
Alternative Price Action: Below 42,828.40 looks for further downside to 42,665.10 & 42,508.10.
Comment: RSI is above 50 levels and pairs above its 55MA.
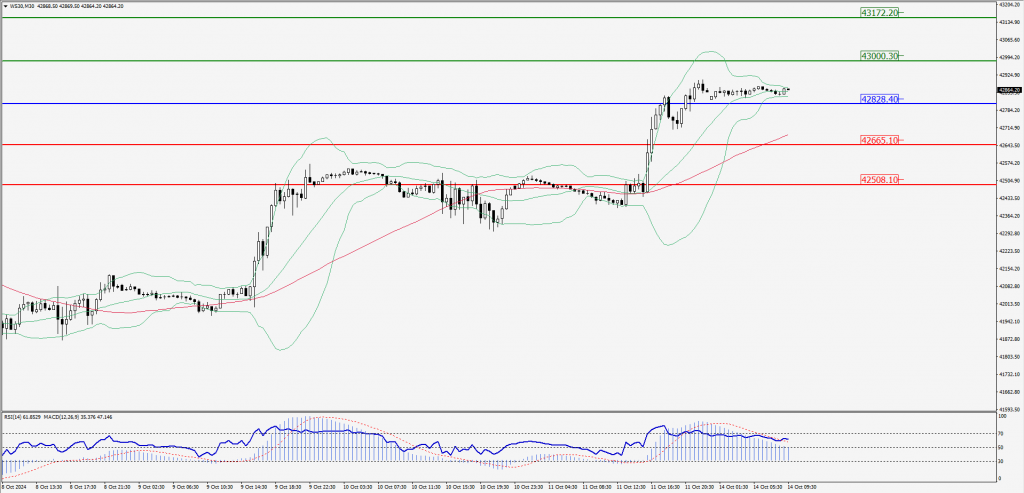
Green Lines Indicate Resistance Levels – Red Lines Indicate Support Levels
Light Blue is a Pivot Point – Black represents the price when the report was produced