Market Wrap: Stocks, Bonds, Commodities
The S&P 500 and Nasdaq ended higher on Tuesday, with big growth shares rising after the previous day’s selloff as Treasury yields tumbled. Bank shares fell along with yields. The benchmark 10-year note yield dropped from more than a three-year high to below 3 percent.
The S&P 500 gain (0.25%) ended at 4,001.05 points, while the Nasdaq Composite up 0.98% to 11,737.70. The Dow Jones Industrial was fell 0.26% to 32,160.74.
MSCI’s index of Asia-Pacific stocks outside Japan is ascend 0.28% to 644.28 levels. Australian index higher 0.19% to 7,064.70. Japanese Nikkei Index ascend 0.18% to 26,213.64.
European stocks were positive on Wednesday, with the Stoxx Europe 50 Index gain 1.19% to 3,597.15, Germany’s DAX ascend 0.55% to 13,610.59, and France’s CAC up 1.39% to 6,201.62, and U.K.’s FTSE 100 increase 0.96% to 7,312.50.
Benchmark 10-year U.S. Treasury fell as demand for safe assets ascend again, today 10-year bond yields a negative 2.9400.
Oil falls on uncertainty over Russian energy embargo by EU. Oil edged lower in early Asian trade on Wednesday, sustaining the previous session’s weakness that was caused by risks to demand from an economic recession and on uncertainty about an embargo on Russian oil by the European Union.
Spot Brent crude oil rose 3.25% to $105.81 per barrel. US West Texas Intermediate crude is up 3.20% to $102.94 a barrel.
The yellow metal gold is ascend 0.40% to 1,848.80 dollars per ounce.
Market Wrap: Forex
The U.S. dollar edged lower in early European trade Wednesday but remains near a two-decade high ahead of the release of key inflation data which could influence Federal Reserve thinking.
Today, the U.S. dollar index measures the Greenback against a trade-weighted basket of six major currencies, which is a rose of 0.30% to 103.632.
The Euro US Dollar (EUR/USD) is a widely traded pair that is up 0.30% today. This left the pair trading around $1.05580.
The Japanese yen was positive against the U.S. dollar on Wednesday as the stock up. Today USD/JPY is fell 0.37% to 129.940 level.
Another commodity-related currency positive against the U.S dollar, AUD/USD ascend 0.76 to 0.69880, and NZD/USD higher 0.69% to 0.63300 level.
EUR/USD Intraday: In a Consolidation Zone
Our pivot point is at 1.05400
Preferable Price Action: Take buy positions above pivot level with targets at 1.05680 & 1.05920 in extension.
Alternative Price Action: Below pivot looks for a further downside to 1.05120 & 1.04900.
Comment: RSI above 50 levels and Pair above 20MA.
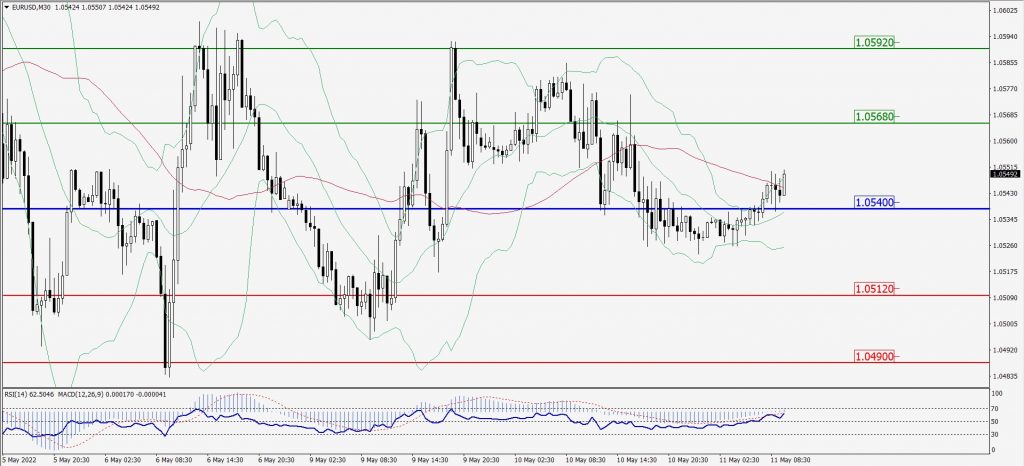
Green Lines Indicate Resistance Levels – Red Lines Indicate Support Levels
Light Blue is a Pivot Point – Black represents the price when the report was produced
GBP/USD Intraday: Major Support Level at 1.23270
Our pivot point is at 1.23270
Preferable Price Action: Buy positions above pivot with targets at 1.23890 & 1.24410 in extension.
Alternative Price Action: The price below pivot would call for further downside to 1.22760 & 1.22320.
Comment: RSI above 50 levels pair above its 20MA & 55MA.
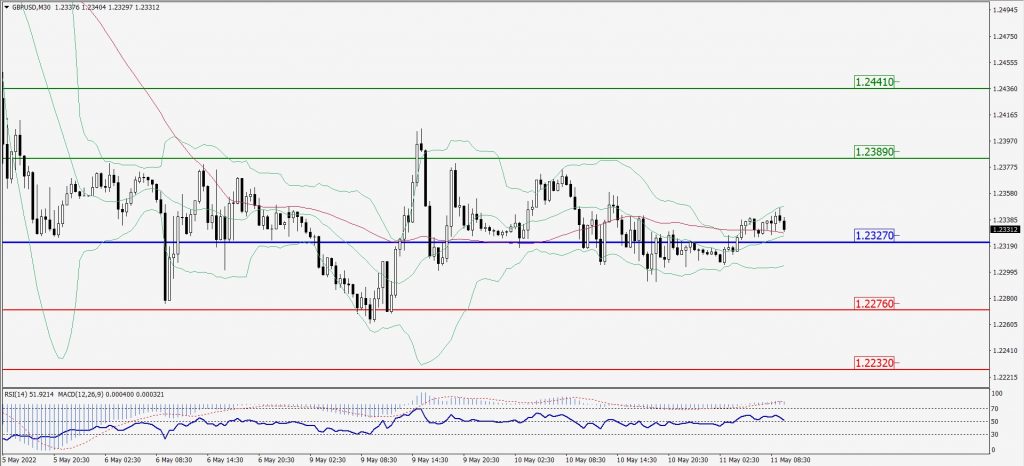
Green Lines Indicate Resistance Levels – Red Lines Indicate Support Levels
Light Blue is a Pivot Point – Black represents the price when the report was produced
USD/JPY Intraday: Trend on The Downside
Our pivot point is at 130.410
Preferable Price Action: Sell position below pivot with the target at 129.490 and 128.780 in extension.
Alternative Price Action: The upside breakout of the pivot would call for 131.230 and 131.960.
Comment: MACD is negative territory and pair below its 20MA & 55MA.

Green Lines Indicate Resistance Levels – Red Lines Indicate Support Levels
Light Blue is a Pivot Point – Black represents the price when the report was produced
AUD/USD Intraday: Trend on The Upside
Our pivot point is at 0.69660
Preferable Price Action: Buy Positions above pivot with targets at 0.70450 & 0.71130 in extension.
Alternative Price Action: Below pivot looks for a further downside with 0.68970 & 0.68350 as targets.
Comment: RSI above 50 levels and Pair above its 20MA & 55MA.

Green Lines Indicate Resistance Levels – Red Lines Indicate Support Levels
Light Blue is a Pivot Point – Black represents the price when the report was produced
CRUDEOIL Intraday: In a Consolidation Zone
Our pivot point is at 99.41
Preferable Price Action: Above pivots buy oil with 107.12 & 113.01 as targets.
Alternative Price Action: Sell crude below pivot with targets at 92.78 and 87.86 in extension.
Comment: MACD is in the positive territory and Pair above its 20MA & 55MA.

Green Lines Indicate Resistance Levels – Red Lines Indicate Support Levels
Light Blue is a Pivot Point – Black represents the price when the report was produced
XAU/USD Intraday: Major Support Level at 1842.40
Our pivot point is 1842.40
Preferable Price Action: Further upside to 1873.20 and 1896.30.
Alternative Price Action: If the price gives a downside breakout of a pivot, then the price extends to 1817.80 and 1798.00.
Comment: MACD is positive territory and Pair above its 20MA & 55MA.

Green Lines Indicate Resistance Levels – Red Lines Indicate Support Levels
Light Blue is a Pivot Point – Black represents the price when the report was produced
Dow Jones Intraday: In a Consolidation Zone
Our pivot point is 31,960.00
Preferable Price Action: Take Buy positions above pivot with targets at 32,960.00 & 33,778.00.
Alternative Price Action: Below 31,960.00 looks for further downside to 31,081.00 & 30,392.00.
Comment: RSI at 50 levels.

Green Lines Indicate Resistance Levels – Red Lines Indicate Support Levels
Light Blue is a Pivot Point – Black represents the price when the report was produced