Market Wrap: Stocks, Bonds, Commodities
US stocks closed higher on Tuesday following positive earnings from top-tier companies and as investors were focused on quarterly results from Magnificent Seven and other megacap growth stocks.
The Dow Jones Industrial Average rose 263.71 points to 38,503.69, the S&P 500 gain 1.20% to 5,070.55 and the Nasdaq Composite ascend 245.34 points to 15,696.64.
MSCI’s index of Asia-Pacific stocks outside Japan is increase 1.90% to 653.21 levels. The Australian index was lower by 0.01% to 7,683.00. Japanese Nikkei Index surged 2.26% today.
European stocks were positive on Wednesday, with the Stoxx Europe 50 Index increase 0.30% to 5,023.05, Germany’s DAX surged 0.23% to 18,184, and France’s CAC higher 0.18% to 8,119.98 and U.K.’s FTSE 100 gain 0.44% to 8,080.49.
Benchmark 10-year U.S. Treasury rose as demand for safe assets surged again, today 10-year bond yields positive 0.89% to 4.640.
Oil prices rose in early trade on Wednesday, adding to gains in the previous session, after industry data showed a surprise drop in U.S. crude stocks last week, a positive sign for demand, and attention shifted away from hostilities in the Middle East.
Spot Brent crude oil descend 0.45% to $88.02 per barrel. US West Texas Intermediate crude is down 0.53% to $82.92 a barrel.
The yellow metal gold is decrease 0.71% to 2,325.50 dollars per ounce.
Market Wrap: Forex
The U.S. dollar rebounded in early European trading Wednesday after the prior session’s selloff, with traders keeping a wary eye on upcoming economic data for further clues of the Federal Reserve’s future monetary policy intentions.
Today, the U.S. dollar index measures the Greenback against a trade-weighted basket of six major currencies, which surged 0.17% to 105.680.
The Euro US Dollar (EUR/USD) is a widely traded pair that is down 0.10% today. This left the pair trading around $1.0688.
The Japanese yen was negative against the U.S. dollar on Wednesday. Today USD/JPY is surged 0.07% to the 154.93 level.
Another commodity-related currency positive against the U.S dollar, AUD/USD rose 0.32% to 0.6505, and NZD/USD surged 0.13% to 0.5938 level.
EUR/USD Intraday: Trend on the downside
Our pivot point is at 1.06940
Preferable Price Action: Take sell positions below pivot level with targets at 1.06780 & 1.06660 in extension.
Alternative Price Action: Above pivot looks for a further upside to 1.07090 & 1.07200.
Comment: RSI is below 50 levels and pairs below its 20MA.

Green Lines Indicate Resistance Levels – Red Lines Indicate Support Levels
Light Blue is a Pivot Point – Black represents the price when the report was produced
GBP/USD Intraday: Trend on the downside
Our pivot point is at 1.24380
Preferable Price Action: Sell positions below pivot with targets at 1.24130 & 1.23950 in extension.
Alternative Price Action: The price above pivot would call for further upside to 1.24620 & 1.24790.
Comment: RSI is below 50 levels and Pairs below its 20MA.

Green Lines Indicate Resistance Levels – Red Lines Indicate Support Levels
Light Blue is a Pivot Point – Black represents the price when the report was produced
USD/JPY Intraday: Trend on the upside
Our pivot point is at 154.850
Preferable Price Action: Buy position above pivot with the target at 155.040 and 155.180 in extension.
Alternative Price Action: The downside breakout of the pivot would call for 154.660 and 154.500.
Comment: MACD is above 50 levels and Paris above its 20MA & 55MA.

Green Lines Indicate Resistance Levels – Red Lines Indicate Support Levels
Light Blue is a Pivot Point – Black represents the price when the report was produced
AUD/USD Intraday: Trend on the upside
Our pivot point is at 0.64990
Preferable Price Action: Buy positions above pivot with targets at 0.65190 & 0.65350 in extension.
Alternative Price Action: Below pivot looks for a further downside with 0.64770 & 0.64600 as targets.
Comment: RSI is above 50 levels and pairs above its 55MA.
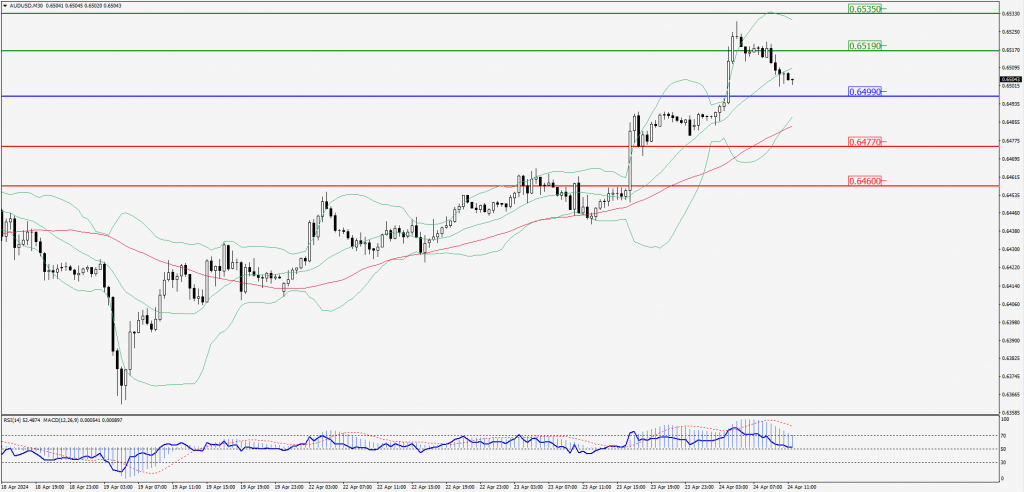
Green Lines Indicate Resistance Levels – Red Lines Indicate Support Levels
Light Blue is a Pivot Point – Black represents the price when the report was produced
CRUDEOIL Intraday: Trend on the downside
Our pivot point is at 83.02
Preferable Price Action: Below pivot sell oil with 82.25 & 81.65 as targets.
Alternative Price Action: Buy crude above pivot with targets at 83.76 and 84.35 in extension.
Comment: MACD is negative territory and pairs below its 20MA.

Green Lines Indicate Resistance Levels – Red Lines Indicate Support Levels
Light Blue is a Pivot Point – Black represents the price when the report was produced
XAU/USD Intraday: Trend at the downside
Our pivot point is 2325.10
Preferable Price Action: Further downside to 2307.80 and 2294.40.
Alternative Price Action: If the price gives an upside breakout of a pivot, then the price extends to 2342.50 and 2357.30.
Comment: MACD is below 50 levels and pairs below its 20MA.

Green Lines Indicate Resistance Levels – Red Lines Indicate Support Levels
Light Blue is a Pivot Point – Black represents the price when the report was produced
Dow Jones Intraday: Support Level at 38,497.20
Our pivot point is 38,497.20
Preferable Price Action: Take buy positions above the pivot with targets at 38,736.90 & 38,922.70.
Alternative Price Action: Below 38,497.20 looks for further downside to 38,236.00 & 38,034.10.
Comment: RSI is above 50 levels and Pairs above its 55MA.

Green Lines Indicate Resistance Levels – Red Lines Indicate Support Levels
Light Blue is a Pivot Point – Black represents the price when the report was produced