Market Wrap: Stocks, Bonds, Commodities
Wall Street stocks closed lower on Thursday as markets were stunned by data showing slower-than-expected US economic growth and persistent inflation, coupled with a sell-off in largecap stocks triggered by disappointing results from Meta Platforms.
The Dow Jones Industrial Average fell 375.12 points to 38,085.80, the S&P 500 lose 0.46% to 5,048.42 and the Nasdaq Composite descend 100.99 points to 15,611.76.
MSCI’s index of Asia-Pacific stocks outside Japan is advance 1.23% to 658.22 levels. The Australian index was lower by 1.39% to 7,575.90. Japanese Nikkei Index surged 0.84% today.
European stocks were positive on Friday, with the Stoxx Europe 50 Index increase 0.72% to 4,974.55, Germany’s DAX surged 0.72% to 18,054.55, and France’s CAC higher 0.36% to 8,045.48 and U.K.’s FTSE 100 gain 0.41% to 8,111.87.
Benchmark 10-year U.S. Treasury rose as demand for safe assets slipped again, today 10-year bond yields negative 0.59% to 4.682.
Oil prices rose in early trade on Friday, as players took stock of the US Treasury secretary’s comments that the country’s economy is likely in a stronger position than indicated by weak first-quarter data, coupled with supply concerns as conflict continues in the Middle East.
Spot Brent crude oil ascend 0.16% to $89.14 per barrel. US West Texas Intermediate crude is up 0.22% to $83.75 a barrel.
The yellow metal gold is increase 0.62% to 2,357.95 dollars per ounce.
Market Wrap: Forex
Most Asian currencies weakened on Friday, while the dollar steadied in anticipation of key inflation data that is expected to factor into the Federal Reserve’s stance on interest rate cuts.
Today, the U.S. dollar index measures the Greenback against a trade-weighted basket of six major currencies, which drop 0.06% to 105.385.
The Euro US Dollar (EUR/USD) is a widely traded pair that is up 0.16% today. This left the pair trading around $1.0745.
The Japanese yen was positive against the U.S. dollar on Friday. Today USD/JPY is surged 0.52% to the 156.45 level.
Another commodity-related currency positive against the U.S dollar, AUD/USD rose 0.51% to 0.6550, and NZD/USD surged 0.30% to 0.5965 level.
EUR/USD Intraday: Trend on the upside
Our pivot point is at 1.07300
Preferable Price Action: Take buy positions above pivot level with targets at 1.07520 & 1.07680 in extension.
Alternative Price Action: Below pivot looks for a further downside to 1.07080 & 1.06910.
Comment: RSI is above 50 levels and pairs above its 20MA & 55MA.
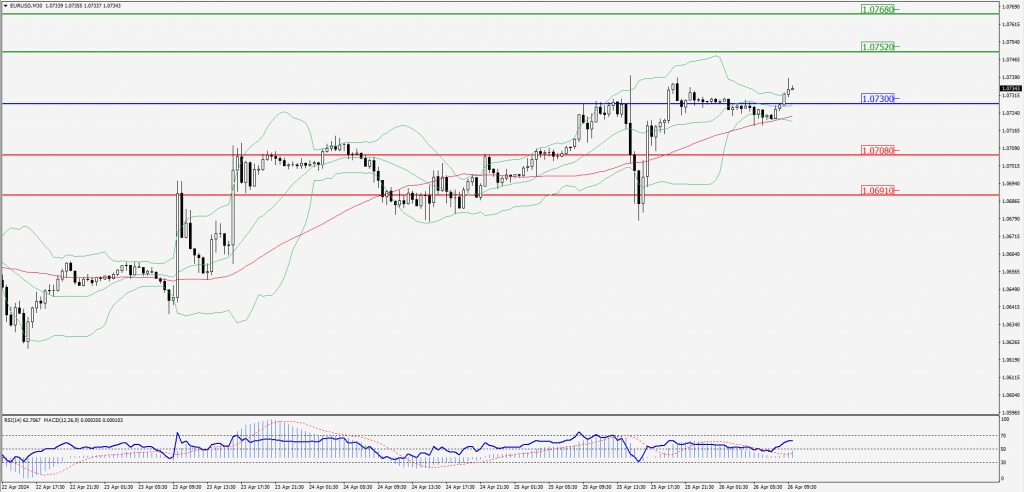
Green Lines Indicate Resistance Levels – Red Lines Indicate Support Levels
Light Blue is a Pivot Point – Black represents the price when the report was produced
GBP/USD Intraday: Support level at 1.24980
Our pivot point is at 1.24980
Preferable Price Action: Buy positions above pivot with targets at 1.25420 & 1.25770 in extension.
Alternative Price Action: The price below pivot would call for further downside to 1.24550 & 1.24170.
Comment: RSI is above 50 levels and Pairs above its 55MA.
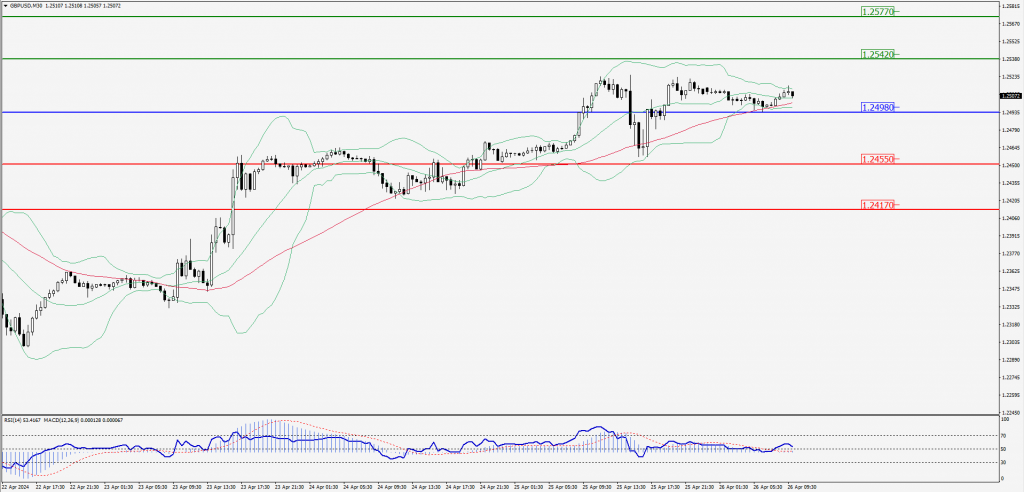
Green Lines Indicate Resistance Levels – Red Lines Indicate Support Levels
Light Blue is a Pivot Point – Black represents the price when the report was produced
USD/JPY Intraday: Major trend on the upside
Our pivot point is at 156.540
Preferable Price Action: Buy position above pivot with the target at 156.920 and 157.260 in extension.
Alternative Price Action: The downside breakout of the pivot would call for 156.160 and 155.840.
Comment: MACD is above 50 levels and Paris above its 20MA & 55MA.
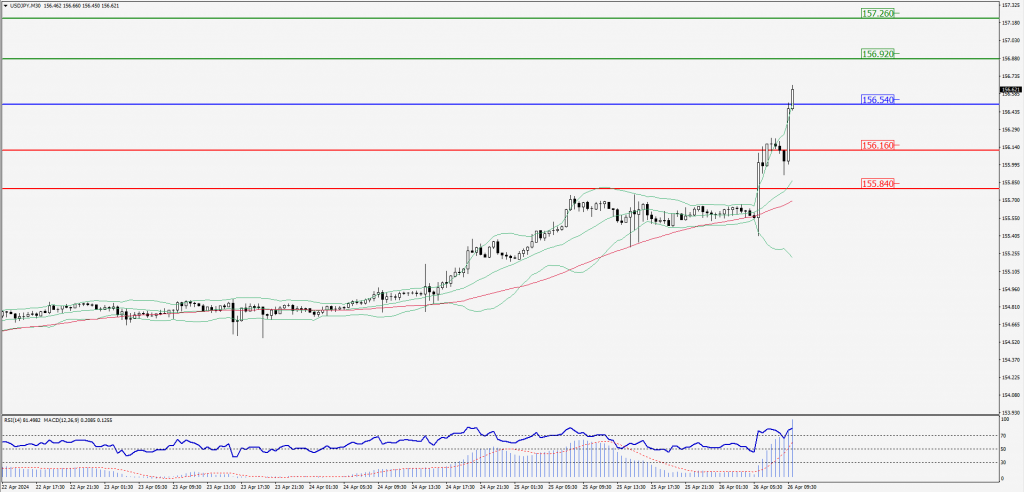
Green Lines Indicate Resistance Levels – Red Lines Indicate Support Levels
Light Blue is a Pivot Point – Black represents the price when the report was produced
AUD/USD Intraday: Trend on the upside
Our pivot point is at 0.65350
Preferable Price Action: Buy positions above pivot with targets at 0.65540 & 0.65680 in extension.
Alternative Price Action: Below pivot looks for a further downside with 0.65170 & 0.65010 as targets.
Comment: RSI is above 50 levels and pairs above its 20MA & 55MA.
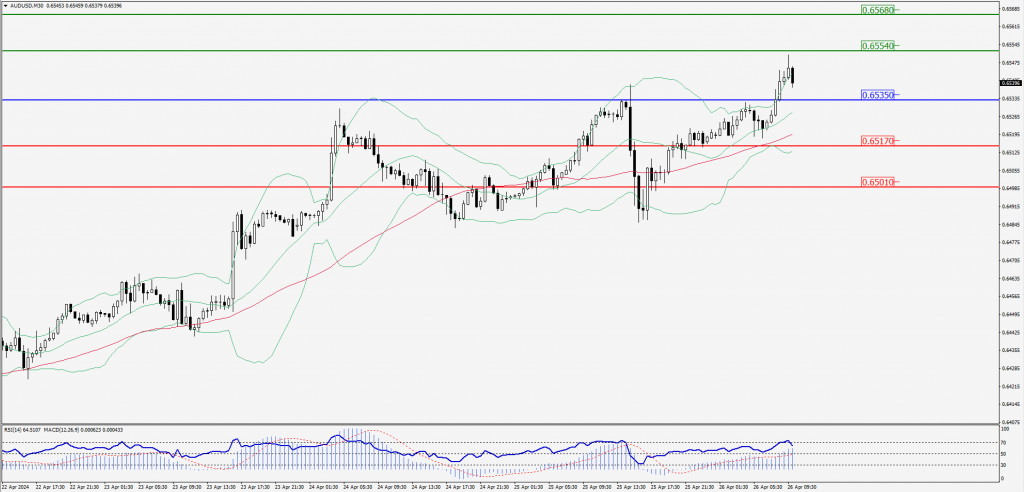
Green Lines Indicate Resistance Levels – Red Lines Indicate Support Levels
Light Blue is a Pivot Point – Black represents the price when the report was produced
CRUDEOIL Intraday: Trend on the upside
Our pivot point is at 83.77
Preferable Price Action: Above pivot buy oil with 84.39 & 84.83 as targets.
Alternative Price Action: Sell crude below pivot with targets at 83.20 and 82.73 in extension.
Comment: MACD is positive territory and pairs above its 20MA & 55MA.
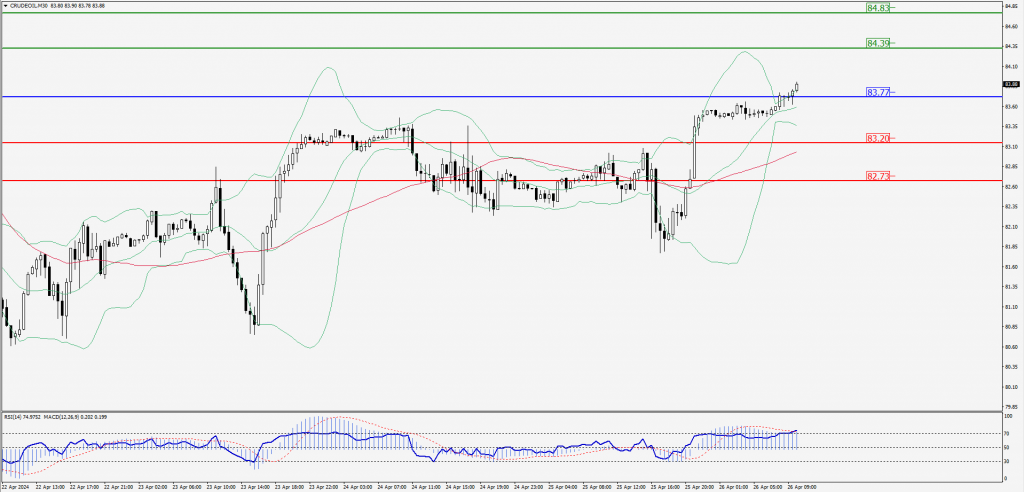
Green Lines Indicate Resistance Levels – Red Lines Indicate Support Levels
Light Blue is a Pivot Point – Black represents the price when the report was produced
XAU/USD Intraday: Trend at the upside
Our pivot point is 2336.60
Preferable Price Action: Further upside to 2346.40 and 2355.00.
Alternative Price Action: If the price gives a downside breakout of a pivot, then the price extends to 2327.10 and 2318.40.
Comment: MACD is above 50 levels and pairs above its 20MA & 55MA.

Green Lines Indicate Resistance Levels – Red Lines Indicate Support Levels
Light Blue is a Pivot Point – Black represents the price when the report was produced
Dow Jones Intraday: Trend on the upside
Our pivot point is 38,117.20
Preferable Price Action: Take buy positions above the pivot with targets at 38,231.00 & 38,325.60.
Alternative Price Action: Below 38,117.20 looks for further downside to 38,001.20 & 37,905.40.
Comment: RSI is at 50 levels.
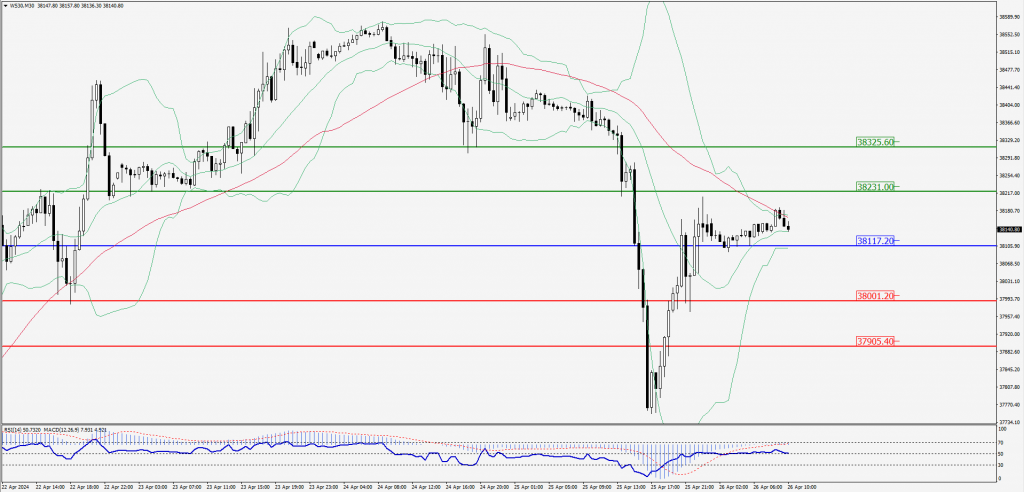
Green Lines Indicate Resistance Levels – Red Lines Indicate Support Levels
Light Blue is a Pivot Point – Black represents the price when the report was produced