Market Wrap: Stocks, Bonds, Commodities
The Nasdaq and the S&P 500 closed sharply lower on Friday and Treasury yields dipped as investors juggled lackluster earnings, uncertainties surrounding central bank policy and geopolitical strife.
The Dow Jones Industrial Average rose 211.02 points to 37,986.40, the S&P 500 loss 0.88% to 4,967.23 and the Nasdaq Composite descend 319.49 points to 15,282.01.
MSCI’s index of Asia-Pacific stocks outside Japan is increase 0.74% to 633.67 levels. The Australian index was higher by 1.08% to 7,649.20. Japanese Nikkei Index surged 0.99% today.
European stocks were mixed on Monday, with the Stoxx Europe 50 Index decrease 0.04% to 4,916.05, Germany’s DAX surged 0.16% to 17,771.25, and France’s CAC lower 0.17% to 8,009.15 and U.K.’s FTSE 100 gain 1.09% to 7,980.97.
Benchmark 10-year U.S. Treasury rose as demand for safe assets surged again, today 10-year bond yields positive 0.80% to 4.6530.
Oil settled slightly higher on Friday, but posted a weekly decline, after Iran played down a reported Israeli attack on its soil, a sign that an escalation of hostilities in the Middle East might be avoided.
Spot Brent crude oil descend 0.96% to $86.45 per barrel. US West Texas Intermediate crude is down 1.01% to $81.40 a barrel.
The yellow metal gold is decrease 1.60% to 2,375.10 dollars per ounce.
Market Wrap: Forex
The euro and yen barely moved in Asian trading on Monday and the U.S. dollar was perched just off five-month highs after last week’s hectic policy and geopolitical developments.
Today, the U.S. dollar index measures the Greenback against a trade-weighted basket of six major currencies, which drop 0.05% to 105.935.
The Euro US Dollar (EUR/USD) is a widely traded pair that is up 0.06% today. This left the pair trading around $1.0660.
The Japanese yen was negative against the U.S. dollar on Monday. Today USD/JPY is surged 0.04% to the 154.69 level.
Another commodity-related currency positive against the U.S dollar, AUD/USD rose 0.28% to 0.6435, and NZD/USD surged 0.31% to 0.5908 level.
EUR/USD Intraday: Trend on the upside
Our pivot point is at 1.06620
Preferable Price Action: Take buy positions above pivot level with targets at 1.06760 & 1.06870 in extension.
Alternative Price Action: Below pivot looks for a further downside to 1.06480 & 1.06360.
Comment: RSI is above 50 levels and pairs above its 55MA.
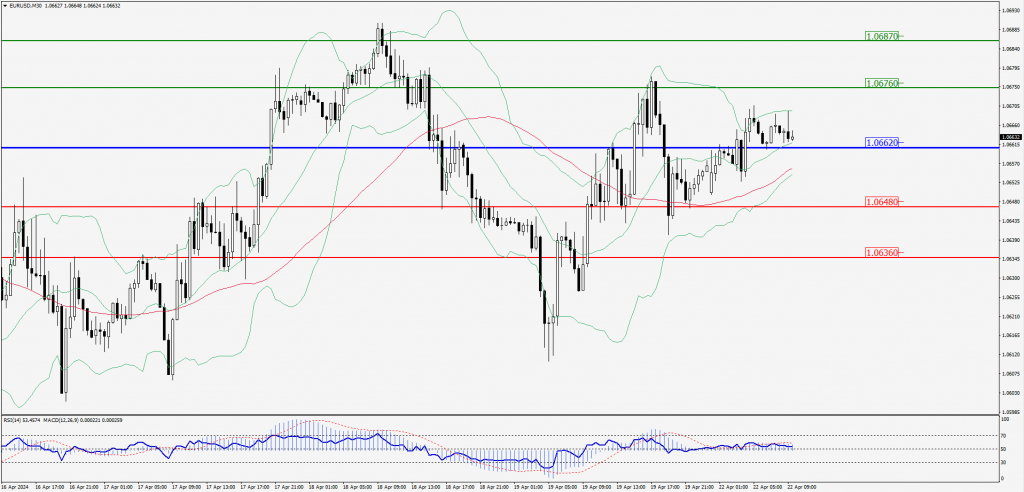
Green Lines Indicate Resistance Levels – Red Lines Indicate Support Levels
Light Blue is a Pivot Point – Black represents the price when the report was produced
GBP/USD Intraday: Trend on the downside
Our pivot point is at 1.23890
Preferable Price Action: Sell positions below pivot with targets at 1.23690 & 1.23540 in extension.
Alternative Price Action: The price above pivot would call for further upside to 1.24100 & 1.24260.
Comment: RSI is below 50 levels and Pairs below its 55MA.
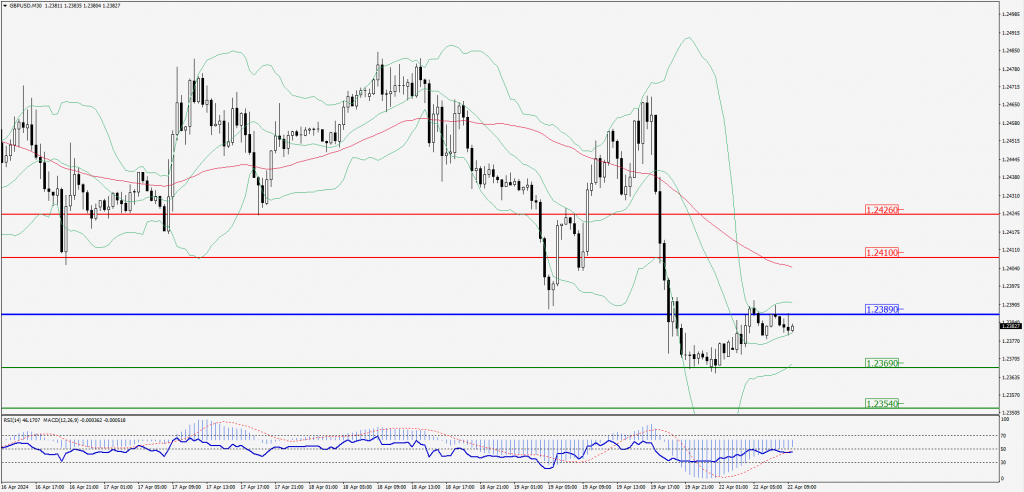
Green Lines Indicate Resistance Levels – Red Lines Indicate Support Levels
Light Blue is a Pivot Point – Black represents the price when the report was produced
USD/JPY Intraday: Resistance level at 154.700
Our pivot point is at 154.700
Preferable Price Action: Sell position below pivot with the target at 154.480 and 154.300 in extension.
Alternative Price Action: The upside breakout of the pivot would call for 154.910 and 155.080.
Comment: MACD is below 50 levels and paris below its 20MA.
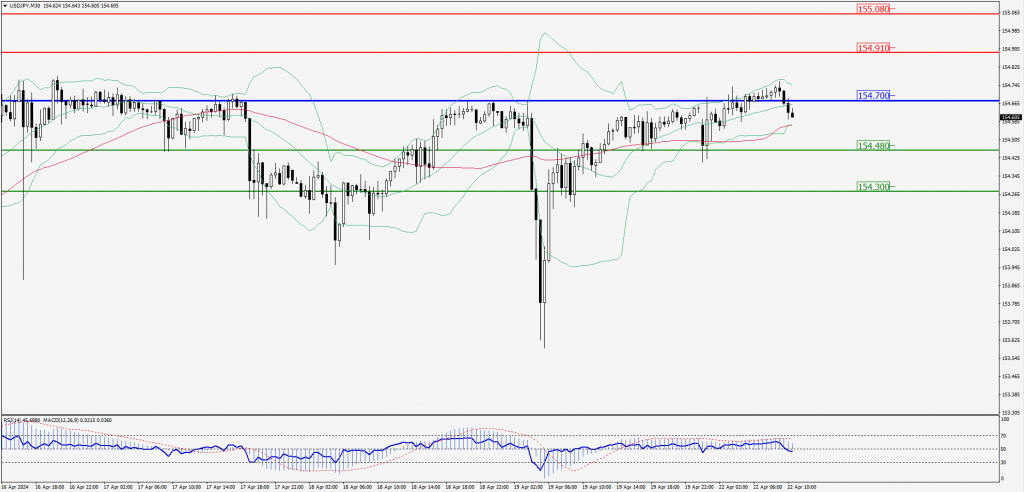
Green Lines Indicate Resistance Levels – Red Lines Indicate Support Levels
Light Blue is a Pivot Point – Black represents the price when the report was produced
AUD/USD Intraday: In a consolidation zone
Our pivot point is at 0.64330
Preferable Price Action: Sell positions below pivot with targets at 0.64190 & 0.64080 in extension.
Alternative Price Action: Above pivot looks for a further upside with 0.64460 & 0.64570 as targets.
Comment: RSI is at 50 levels and pairs below its 55MA.
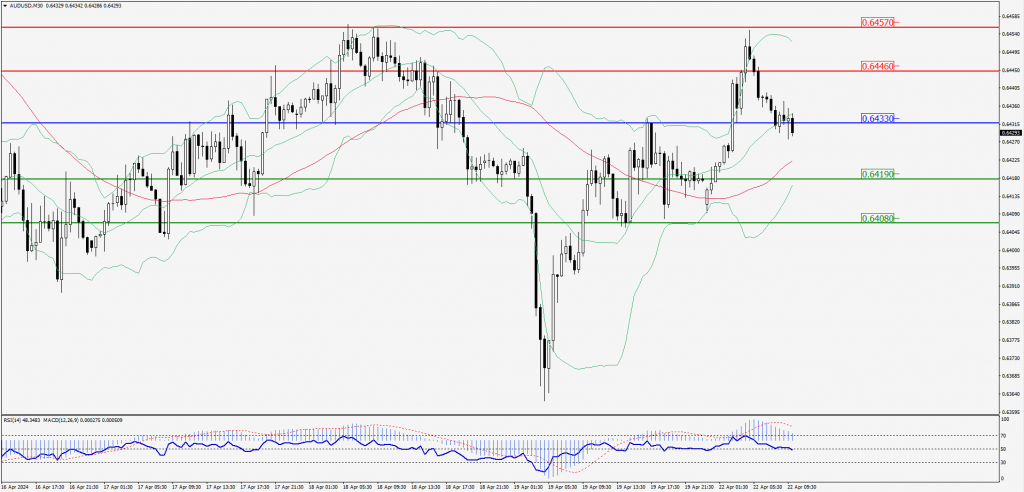
Green Lines Indicate Resistance Levels – Red Lines Indicate Support Levels
Light Blue is a Pivot Point – Black represents the price when the report was produced
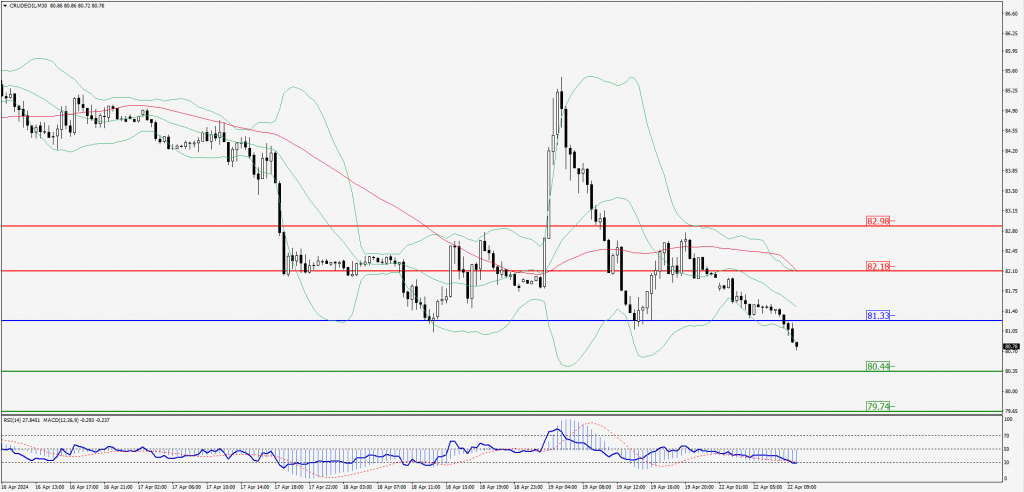
CRUDEOIL Intraday: Major trend on the downside
Our pivot point is at 81.33
Preferable Price Action: Below pivot sell oil with 80.44 & 79.74 as targets.
Alternative Price Action: Buy crude above pivot with targets at 82.18 and 82.98 in extension.
Comment: MACD is negative territory and pairs below its 20MA & 55MA.
Green Lines Indicate Resistance Levels – Red Lines Indicate Support Levels
Light Blue is a Pivot Point – Black represents the price when the report was produced
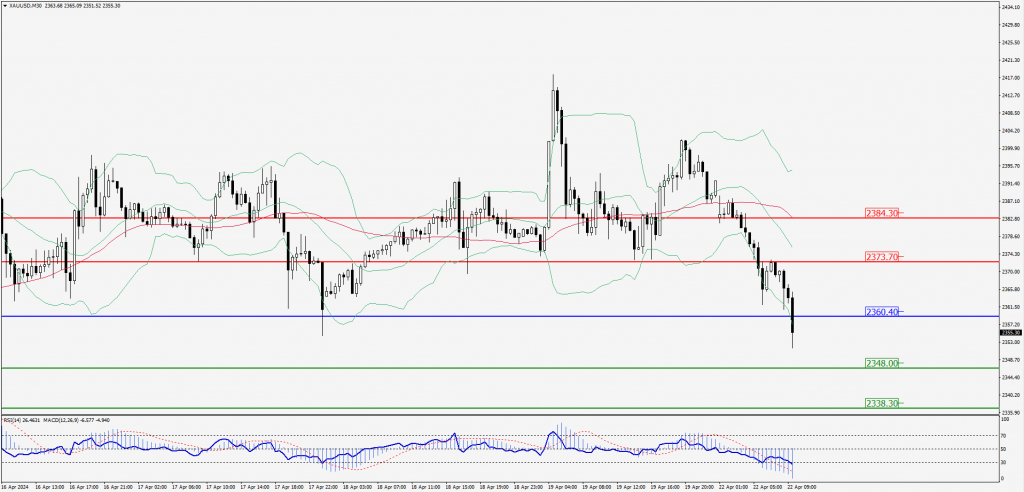
XAU/USD Intraday: Major trend at the downside
Our pivot point is 2360.40
Preferable Price Action: Further downside to 2348.00 and 2338.30.
Alternative Price Action: If the price gives an upside breakout of a pivot, then the price extends to 2373.70 and 2384.30.
Comment: MACD is below 50 levels and pairs below its 20MA & 55MA.
Green Lines Indicate Resistance Levels – Red Lines Indicate Support Levels
Light Blue is a Pivot Point – Black represents the price when the report was produced
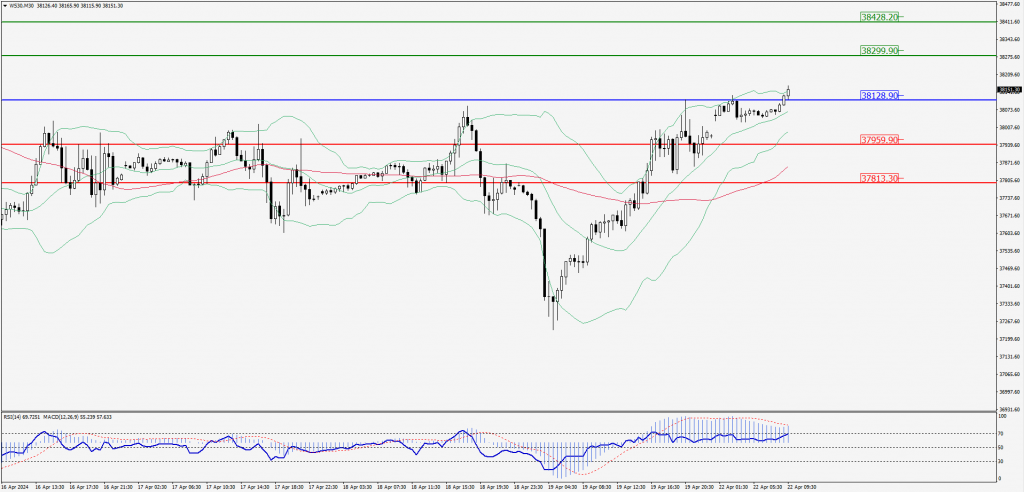
Dow Jones Intraday: Major trend on the upside
Our pivot point is 38,128.90
Preferable Price Action: Take buy positions above the pivot with targets at 38,299.90 & 38,428.20.
Alternative Price Action: Below 38,128.90 looks for further downside to 37,959.90 & 37,813.30.
Comment: RSI is above 50 levels and Pairs above its 20MA & 55MA.
Green Lines Indicate Resistance Levels – Red Lines Indicate Support Levels
Light Blue is a Pivot Point – Black represents the price when the report was produced