Market Wrap: Stocks, Bonds, Commodities
Wall Street stocks closed sharply lower and Treasury yields fell in Wednesday’s volatile session as oil prices rallied and investors worried about the potential for an economic slowdown.
The S&P 500 lose (1.65%) ended at 3,935.18 points, while the Nasdaq Composite down 3.18% to 11,364.24. The Dow Jones Industrial was fell 1.02% to 31,834.11.
MSCI’s index of Asia-Pacific stocks outside Japan is drop 3.34% to 629.04 levels. Australian index lower 1.75% to 6,941.00. Japanese Nikkei Index drop 1.77% to 25,748.72.
European stocks were negative on Thursday, with the Stoxx Europe 50 Index lose 2.19% to 3,568.15, Germany’s DAX drop 1.98% to 13,560.53, and France’s CAC down 1.92% to 6,149.57, and U.K.’s FTSE 100 decrease 1.99% to 7,201.60.
Benchmark 10-year U.S. Treasury fell as demand for safe assets ascend again, today 10-year bond yields a negative 2.8390.
Oil prices rose more than 5 percent on Thursday after flows of Russian gas to Europe fell and Russia sanctioned some European gas companies, adding to uncertainty in world energy markets.
Spot Brent crude oil fell 1.93% to $105.44 per barrel. US West Texas Intermediate crude is down 2.22% to $103.37 a barrel.
The yellow metal gold is drop 0.17% to 1,850.70 dollars per ounce.
Market Wrap: Forex
The U.S. dollar strengthened in early European trade Thursday to a new two-decade high after U.S. inflation remained stubbornly high, while sterling weakened on disappointing U.K. growth data.
Today, the U.S. dollar index measures the Greenback against a trade-weighted basket of six major currencies, which is a rose of 0.41% to 104.315.
The Euro US Dollar (EUR/USD) is a widely traded pair that is down 0.53% today. This left the pair trading around $1.04570.
The Japanese yen was positive against the U.S. dollar on Thursday as the stock up. Today USD/JPY is fell 1.04% to 128.590 level.
Another commodity-related currency negative against the U.S dollar, AUD/USD drop 0.71 to 0.68870, and NZD/USD lower 0.84% to 0.62460 level.
EUR/USD Intraday: Trend on The Downside
Our pivot point is at 1.04890
Preferable Price Action: Take sell positions below pivot level with targets at 1.04130 & 1.03650 in extension.
Alternative Price Action: Above pivot looks for a further upside to 1.05600 & 1.06120.
Comment: RSI below 50 levels and Pair below its 20MA & 55MA.
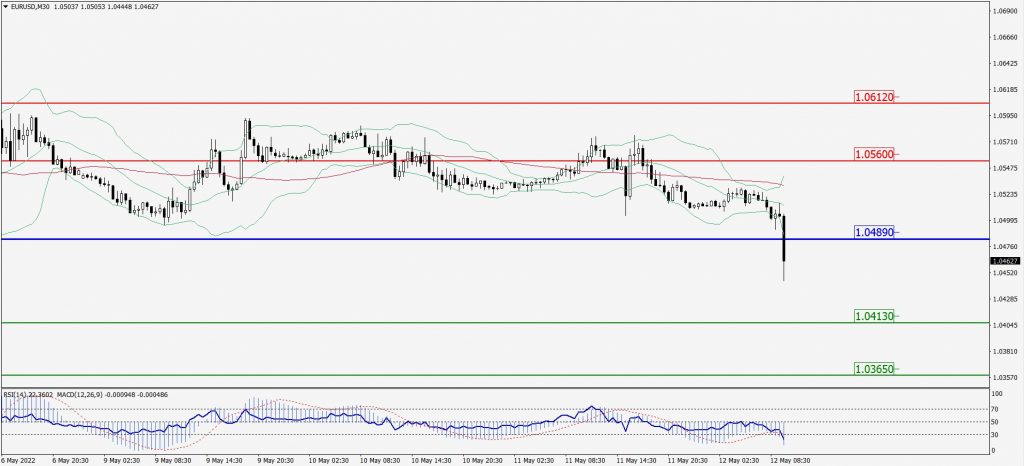
Green Lines Indicate Resistance Levels – Red Lines Indicate Support Levels
Light Blue is a Pivot Point – Black represents the price when the report was produced
GBP/USD Intraday: Major Resistance Level at 1.22500
Our pivot point is at 1.22500
Preferable Price Action: Sell positions below pivot with targets at 1.21270 & 1.20370 in extension.
Alternative Price Action: The price above pivot would call for further upside to 1.23500 & 1.24380.
Comment: RSI below 50 levels pair below its 20MA & 55MA.
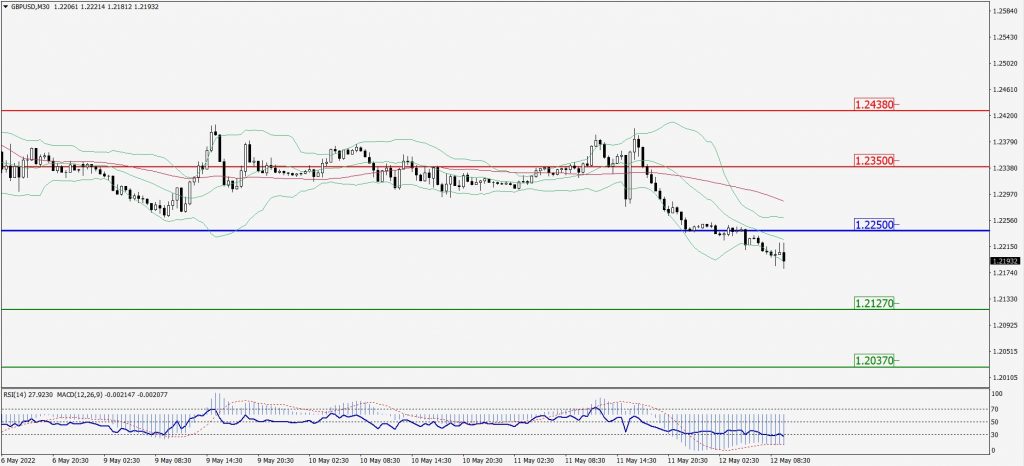
Green Lines Indicate Resistance Levels – Red Lines Indicate Support Levels
Light Blue is a Pivot Point – Black represents the price when the report was produced
USD/JPY Intraday: Major Support Level at 129.680
Our pivot point is at 129.680
Preferable Price Action: Sell position below pivot with the target at 128.210 and 127.260 in extension.
Alternative Price Action: The upside breakout of the pivot would call for 131.020 and 132.000.
Comment: MACD is negative territory and pair below its 20MA & 55MA.
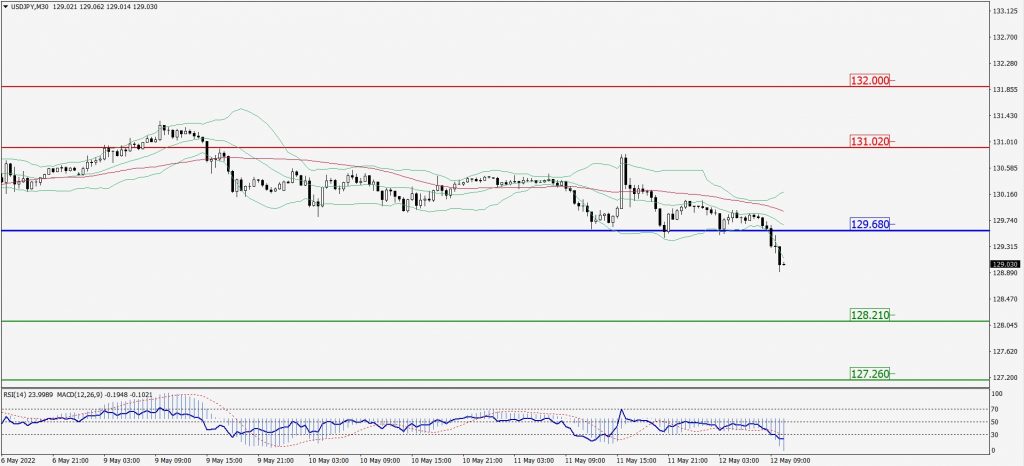
Green Lines Indicate Resistance Levels – Red Lines Indicate Support Levels
Light Blue is a Pivot Point – Black represents the price when the report was produced
AUD/USD Intraday: In a Consolidation Zone
Our pivot point is at 0.69310
Preferable Price Action: Sell Positions below pivot with targets at 0.68080 & 0.67170 in extension.
Alternative Price Action: Above pivot looks for a further upside with 0.70320 & 0.71210 as targets.
Comment: RSI below 50 levels and Pair below its 20MA & 55MA.
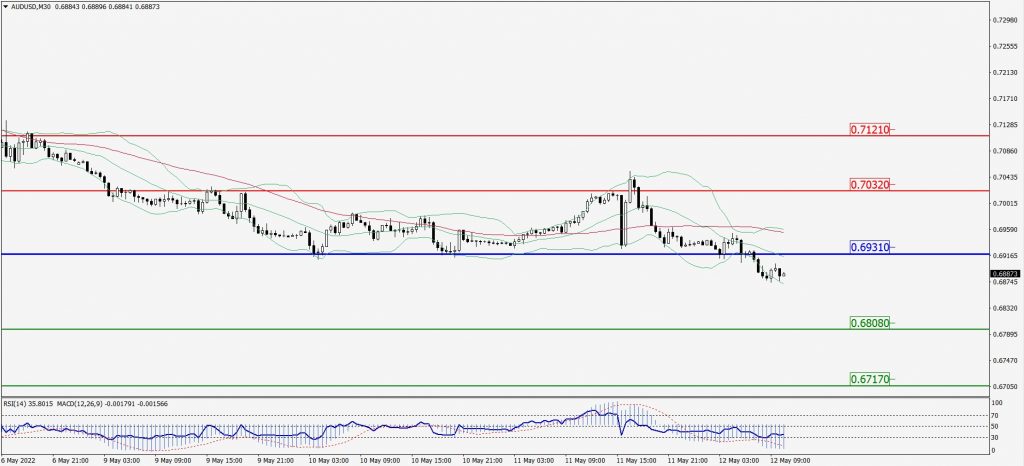
Green Lines Indicate Resistance Levels – Red Lines Indicate Support Levels
Light Blue is a Pivot Point – Black represents the price when the report was produced
CRUDEOIL Intraday: In a Consolidation Zone
Our pivot point is at 103.04
Preferable Price Action: Below pivots sell oil with 99.45 & 97.09 as targets.
Alternative Price Action: Buy crude above pivot with targets at 105.90 and 108.44 in extension.
Comment: MACD is in the negative territory and Pair below its 20MA & 55MA.
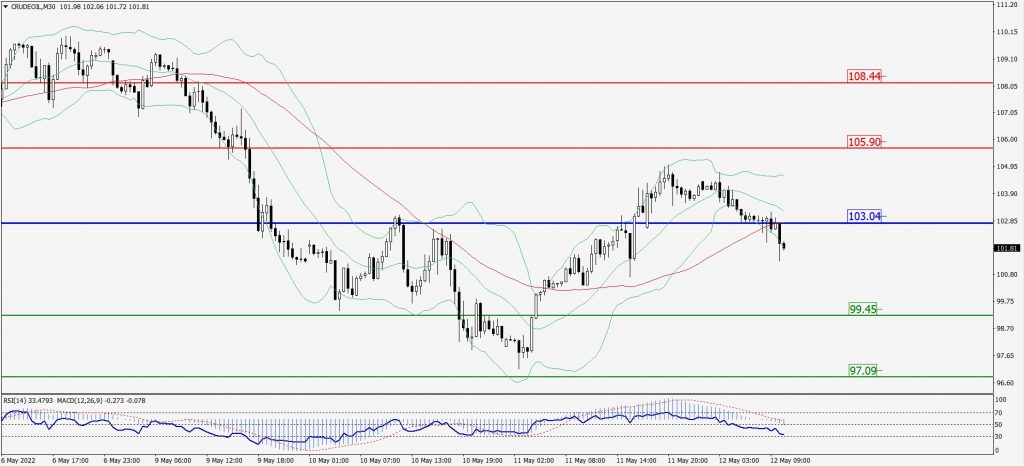
Green Lines Indicate Resistance Levels – Red Lines Indicate Support Levels
Light Blue is a Pivot Point – Black represents the price when the report was produced
XAU/USD Intraday: In a Consolidation Zone
Our pivot point is 1843.50
Preferable Price Action: Further upside to 1870.90 and 1896.60.
Alternative Price Action: If the price gives a downside breakout of a pivot, then the price extends to 1817.40 and 1794.00.
Comment: MACD is flat territory.
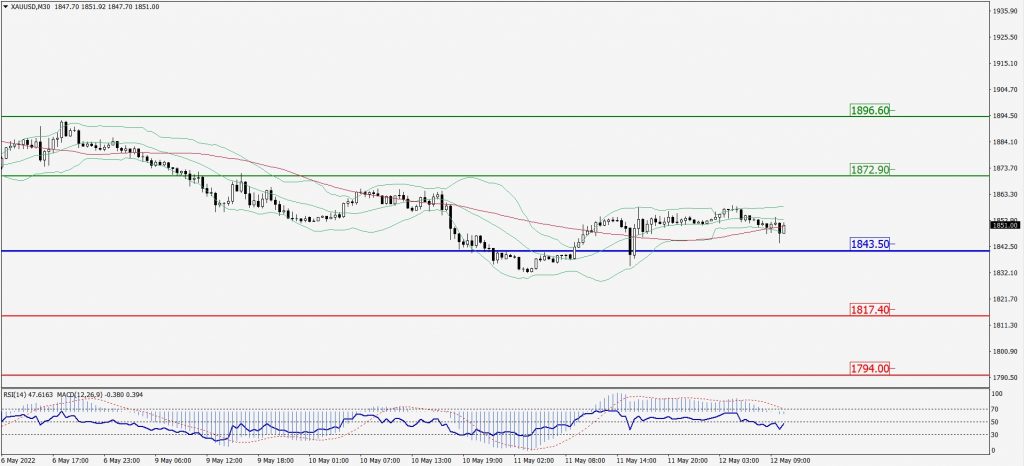
Green Lines Indicate Resistance Levels – Red Lines Indicate Support Levels
Light Blue is a Pivot Point – Black represents the price when the report was produced
Dow Jones Intraday: Trend on The Downside
Our pivot point is 31,996.00
Preferable Price Action: Take Sell positions below pivot with targets at 30,740.00 & 29,922.00.
Alternative Price Action: Above 31,996.00 looks for further upside to 33,077.00 & 33,961.00.
Comment: RSI at 50 levels and Pair below its 20MA & 55MA.
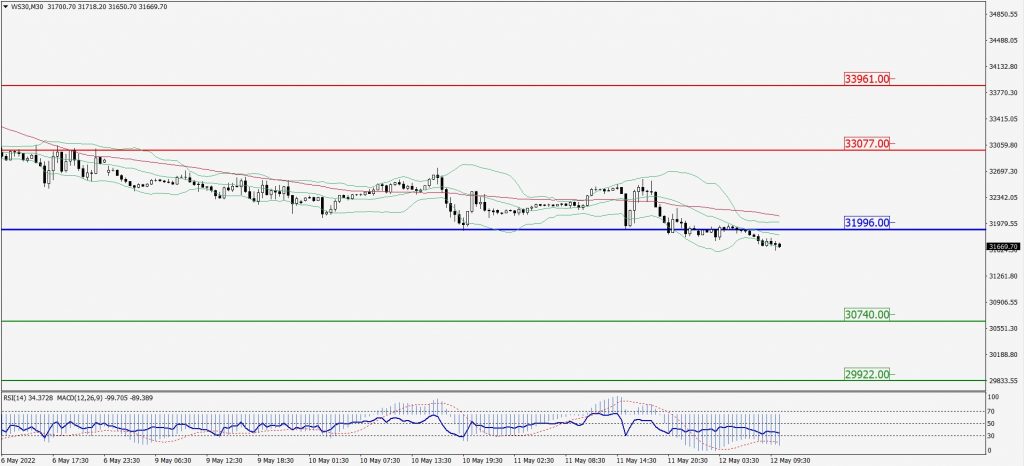
Green Lines Indicate Resistance Levels – Red Lines Indicate Support Levels
Light Blue is a Pivot Point – Black represents the price when the report was produced