Market Wrap: Stocks, Bonds, Commodities
The S&P 500 ended below 4,000 for the first time since late March 2021 and the Nasdaq dropped more than 4% on Monday in a selloff led by mega-cap growth shares as investors grew more concerned about rising interest rates.
The S&P 500 lose (3.20%) ended at 3,991.24 points, while the Nasdaq Composite down 4.29% to 11,623.25. The Dow Jones Industrial was fell 1.99% to 32,245.70.
MSCI’s index of Asia-Pacific stocks outside Japan is drop 0.55% to 643.68 levels. Australian index lower 0.98% to 7,051.20. Japanese Nikkei Index drop 0.58% to 26,167.10.
European stocks were positive on Tuesday, with the Stoxx Europe 50 Index gain 1.39% to 3,575.25, Germany’s DAX ascend 1.46% to 13,576.59, and France’s CAC up 1.18% to 6,157.62, and U.K.’s FTSE 100 increase 0.83% to 7,276.85.
Benchmark 10-year U.S. Treasury fell as demand for safe assets ascend again, today 10-year bond yields a negative 3.0240.
Oil prices edged lower in early Asian trade on Tuesday, adding to a 6% slump in the previous session, as coronavirus lockdowns in top oil importer China and potential economic ructions in Europe fed worries about the demand outlook.
Spot Brent crude oil rose 0.72% to $106.74 per barrel. US West Texas Intermediate crude is up 0.88% to $104.08 a barrel.
The yellow metal gold is ascend 0.16% to 1,861.31 dollars per ounce.
Market Wrap: Forex
The U.S. dollar stabilized in early European trade Tuesday after earlier falling back from a two-decade high as traders reappraise the likelihood of aggressive Federal Reserve rate increases.
Today, the U.S. dollar index measures the Greenback against a trade-weighted basket of six major currencies, which is a fell of 0.02% to 103.680.
The Euro US Dollar (EUR/USD) is a widely traded pair that is up 0.08% today. This left the pair trading around $1.05630.
The Japanese yen was positive against the U.S. dollar on Tuesday as the stock up. Today USD/JPY is fell 0.04% to 130.190 level.
Another commodity-related currency mixed against the U.S dollar, AUD/USD ascend 0.03 to 0.69570, and NZD/USD lower 0.06% to 0.63240 level.
EUR/USD Intraday: In a Consolidation Zone
Our pivot point is at 1.05800
Preferable Price Action: Take Sell positions below pivot level with targets at 1.05170 & 1.04670 in extension.
Alternative Price Action: Above pivot looks for a further upside to 1.06460 & 1.06950.
Comment: RSI Below 50 levels and Pair below 20MA.
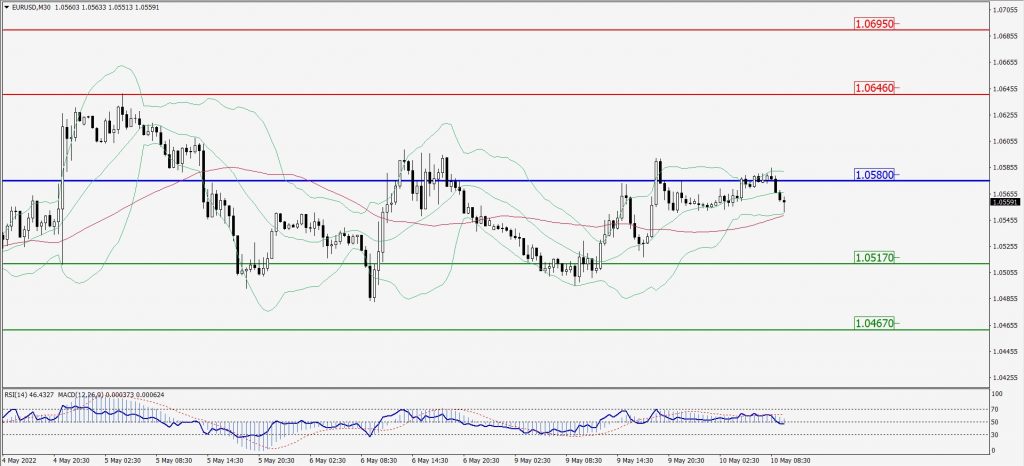
Green Lines Indicate Resistance Levels – Red Lines Indicate Support Levels
Light Blue is a Pivot Point – Black represents the price when the report was produced
GBP/USD Intraday: Major Resistance Level at 1.23950
Our pivot point is at 1.23950
Preferable Price Action: Sell positions below pivot with targets at 1.22010 & 1.20430 in extension.
Alternative Price Action: The price above pivot would call for further upside to 1.25750 & 1.27380.
Comment: RSI below 50 levels pair below 20MA.
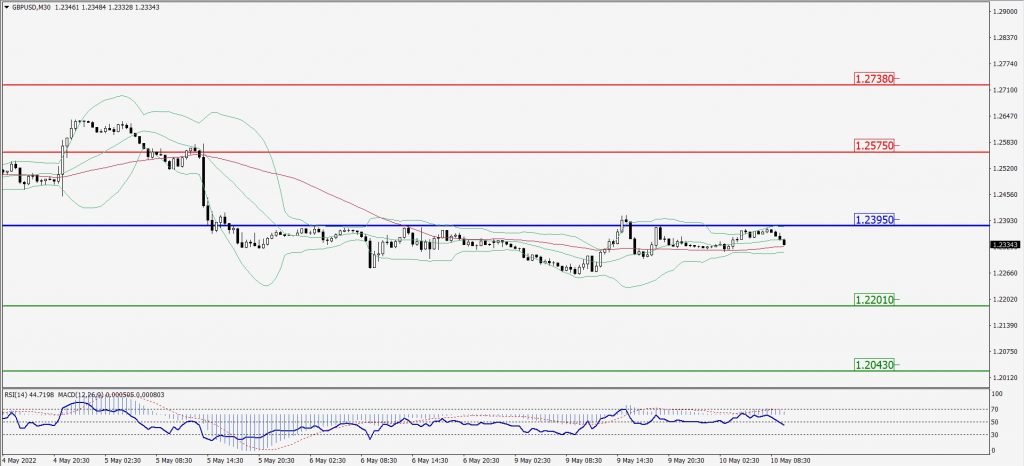
Green Lines Indicate Resistance Levels – Red Lines Indicate Support Levels
Light Blue is a Pivot Point – Black represents the price when the report was produced
USD/JPY Intraday: In a Consolidation Zone
Our pivot point is at 130.610
Preferable Price Action: Sell position below pivot with the target at 129.730 and 129.020 in extension.
Alternative Price Action: The upside breakout of the pivot would call for 131.490 and 132.140.
Comment: MACD is flat territory and pair below 55MA.
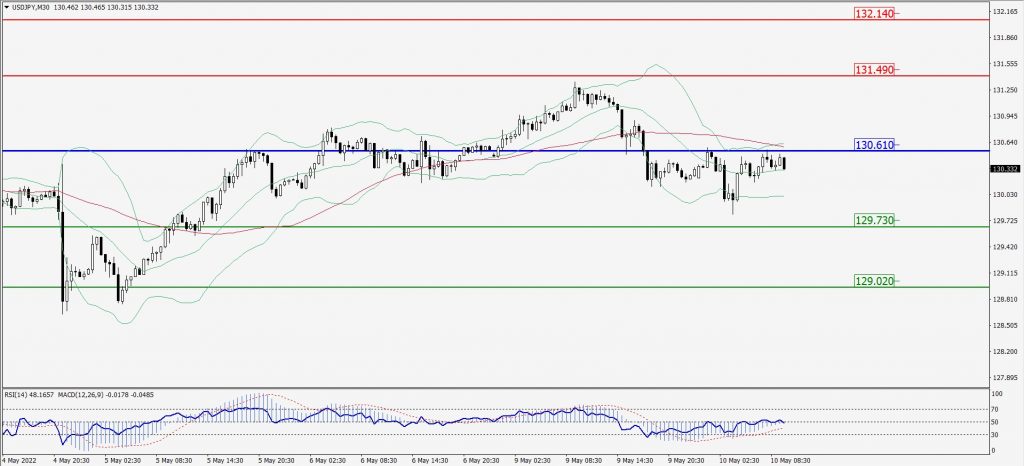
Green Lines Indicate Resistance Levels – Red Lines Indicate Support Levels
Light Blue is a Pivot Point – Black represents the price when the report was produced
AUD/USD Intraday: Trend on The Downside
Our pivot point is at 0.70220
Preferable Price Action:Sell Positions below pivot with targets at 0.68660 & 0.67330 in extension.
Alternative Price Action: Above pivot looks for a further upside with 0.71720 & 0.72950 as targets.
Comment: RSI below 50 levels and Pair below 55MA.
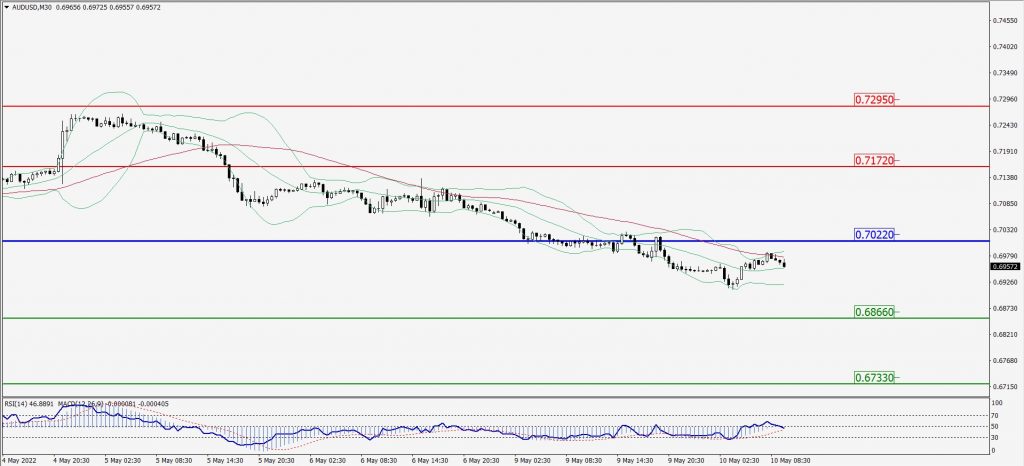
Green Lines Indicate Resistance Levels – Red Lines Indicate Support Levels
Light Blue is a Pivot Point – Black represents the price when the report was produced
CRUDEOIL Intraday: May Trend Reverse from 104.35
Our pivot point is at 104.35
Preferable Price Action: Below pivots sell oil with 97.58 & 91.96 as targets.
Alternative Price Action: Buy crude above pivot with targets at 111.07 and 116.50 in extension.
Comment: MACD is in the flat territory and Pair below 55MA.
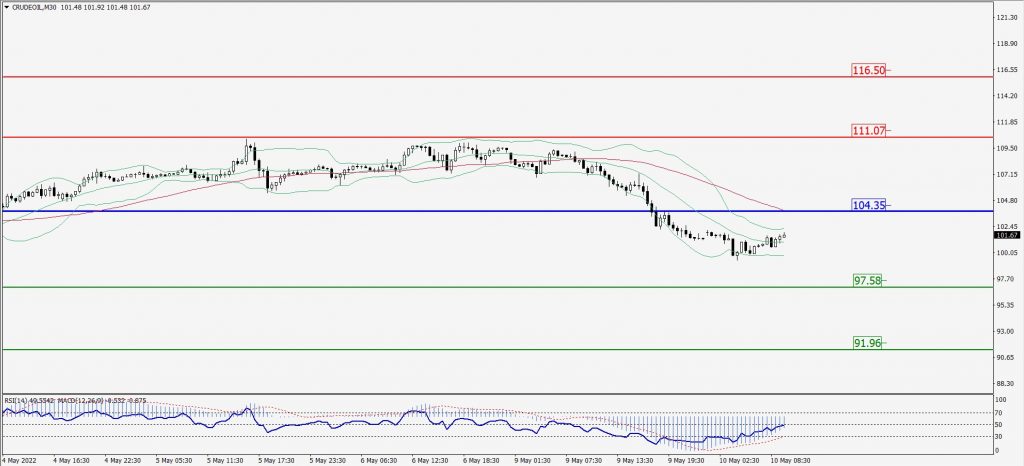
Green Lines Indicate Resistance Levels – Red Lines Indicate Support Levels
Light Blue is a Pivot Point – Black represents the price when the report was produced
XAU/USD Intraday: Major Support Level at 1856.60
Our pivot point is 1856.60
Preferable Price Action: Further downside to 1829.30 and 1808.50.
Alternative Price Action: If the price gives an upside breakout of a pivot, then the price extends to 1885.00 and 1907.40.
Comment: MACD is positive territory and Pair above 20MA.
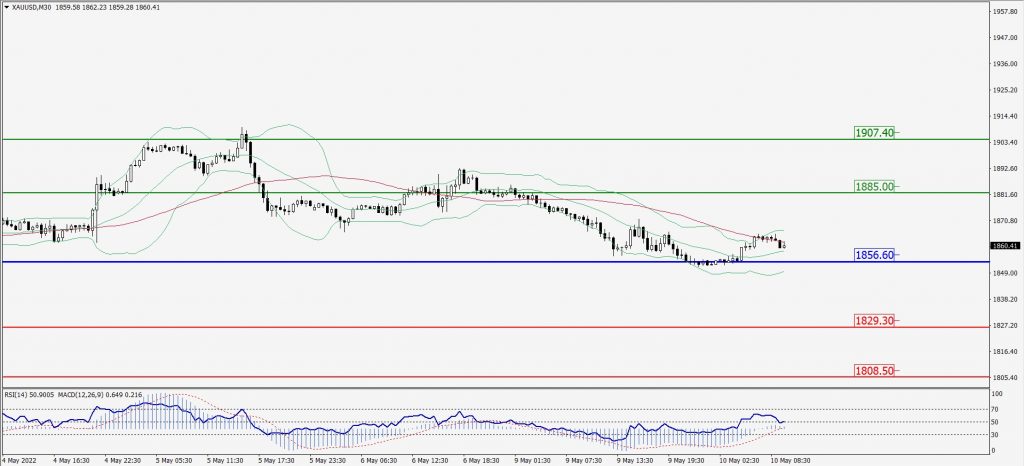
Green Lines Indicate Resistance Levels – Red Lines Indicate Support Levels
Light Blue is a Pivot Point – Black represents the price when the report was produced
Dow Jones Intraday: Trend on The Upside
Our pivot point is 32,323.00
Preferable Price Action: Take Buy positions above pivot with targets at 33,116.00 & 33,753.00.
Alternative Price Action: Below 32,323.00 looks for further downside to 31,586.00 & 30,999.00.
Comment: RSI above 50 levels and pair above its 20MA & 55MA.
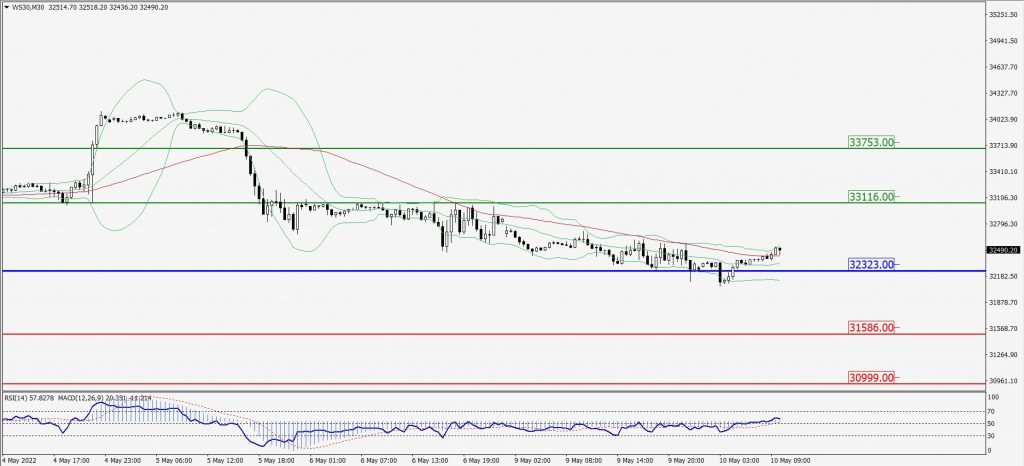
Green Lines Indicate Resistance Levels – Red Lines Indicate Support Levels
Light Blue is a Pivot Point – Black represents the price when the report was produced