Market Wrap: Stocks, Bonds, Commodities
US stocks tumbled on Friday after a stronger-than-expected jobs report locked in expectations that the Federal Reserve is sticking with a steady diet of rate hikes, while supply cuts continued to boost oil prices.
The Dow Jones Industrial Average fell 630.15 points to 29,296.79, the S&P 500 lose 104.86 points to 3,639.66 and the Nasdaq Composite subtract 420.91 points to 10,652.41.
MSCI’s index of Asia-Pacific stocks outside Japan is drop 1.39% to 560.98 levels. Australian index lower 1.40% to 6,667.80. Japanese Nikkei Index drop 0.71% to 27,116.11.
European stocks were negative on Monday, with the Stoxx Europe 50 Index fell 0.77% to 3,349.55, Germany’s DAX drop 0.26% to 12,242.10, and France’s CAC down 0.84% to 5,936.89, and U.K.’s FTSE 100 slipped 0.63% to 6,946.15.
Benchmark 10-year U.S. Treasury fell as demand for safe assets ascend again, today 10-year bond yields a positive 0.06% to 3.8880.
Oil prices slipped on Monday, easing off five-week highs, as the market took profits following strong gains last week on expectations of tighter supplies after OPEC+ cuts and ahead of the European Union embargo on Russian oil.
Spot Brent crude oil subtract 0.76% to $97.22 per barrel. US West Texas Intermediate crude is down 0.63% to $92.06 a barrel.
The yellow metal gold is decline 1.13% to 1,690.00 dollars per ounce.
Market Wrap: Forex
The dollar strengthened in early dealings in Europe on Monday, after Russia launched a barrage of missile attacks against Ukrainian cities including the capital Kyiv, in an apparent response to the attack on the Kerch Strait bridge over the weekend.
Today, the U.S. dollar index measures the Greenback against a trade-weighted basket of six major currencies, which is rose 0.25% to 112.970.
The Euro US Dollar (EUR/USD) is a widely traded pair that is down 0.35% today. This left the pair trading around $0.97060.
The Japanese yen was positive against the U.S. dollar on Monday as the stock up. Today USD/JPY is ascend 0.09% to 145.470 level.
Another commodity-related currency negative against the U.S dollar, AUD/USD slipped 0.94% to 0.63080, and NZD/USD subtract 0.46 to 0.55850 level.
EUR/USD Intraday: Resistance level at 0.97600
Our pivot point is at 0.97600
Preferable Price Action: Take sell positions below pivot level with targets at 0.96980 & 0.96420 in extension.
Alternative Price Action: Above pivot looks for a further upside to 0.98210 & 0.98740.
Comment: RSI below 50 levels and Pairs below its 20MA & 55MA.
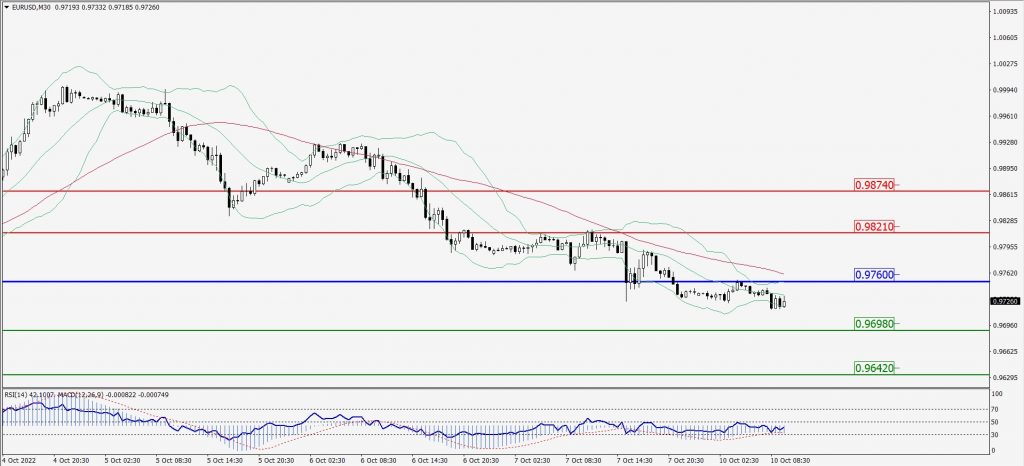
Green Lines Indicate Resistance Levels – Red Lines Indicate Support Levels
Light Blue is a Pivot Point – Black represents the price when the report was produced
GBP/USD Intraday: Support level at 1.10780
Our pivot point is at 1.10780
Preferable Price Action: Buy positions above pivot with targets at 1.11800 & 1.12420 in extension.
Alternative Price Action: The price below pivot would call for further downside to 1.09980 & 1.09300.
Comment: RSI above 50 levels and Pairs above 20MA.
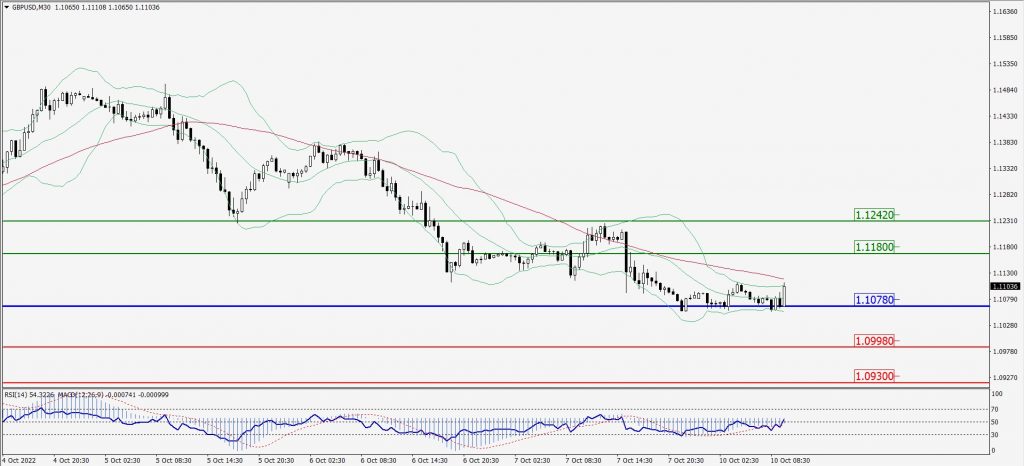
Green Lines Indicate Resistance Levels – Red Lines Indicate Support Levels
Light Blue is a Pivot Point – Black represents the price when the report was produced
USD/JPY Intraday: Trend on the downside
Our pivot point is at 145.490
Preferable Price Action: Sell position below pivot with the target at 145.060 and 144.760 in extension.
Alternative Price Action: The upside breakout of the pivot would call for 145.850 and 146.150.
Comment: MACD is negative territory and Pairs below 20MA.
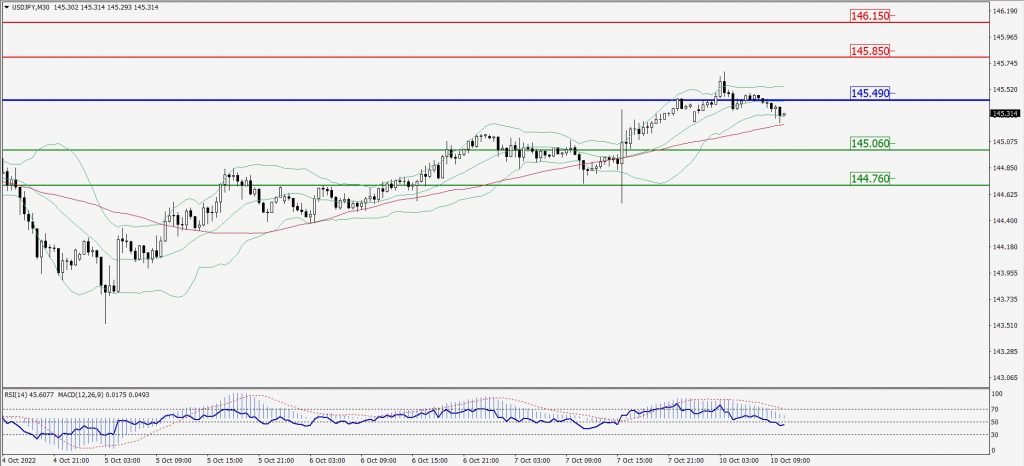
Green Lines Indicate Resistance Levels – Red Lines Indicate Support Levels
Light Blue is a Pivot Point – Black represents the price when the report was produced
AUD/USD Intraday: Trend on the downside
Our pivot point is at 0.63520
Preferable Price Action: Sell Positions below pivot with targets at 0.62910 & 0.62460 in extension.
Alternative Price Action: Above pivot looks for a further upside with 0.64020 & 0.64450 as targets.
Comment: RSI below 50 levels and Pairs below its 20MA & 55MA.
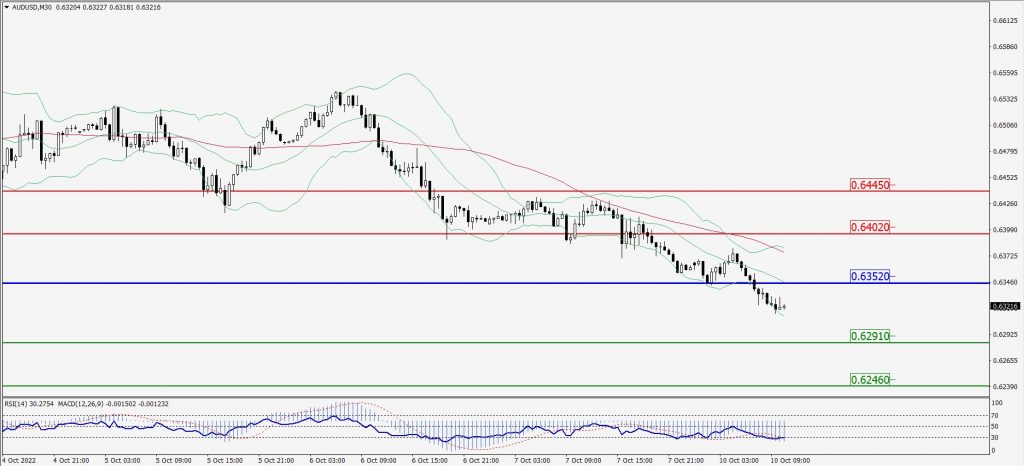
Green Lines Indicate Resistance Levels – Red Lines Indicate Support Levels
Light Blue is a Pivot Point – Black represents the price when the report was produced
CRUDEOIL Intraday: Trend on the upside
Our pivot point is at 90.96
Preferable Price Action: Above pivots buy oil with 93.42 & 95.20 as targets.
Alternative Price Action: Sell crude below pivot with targets at 88.92 and 87.05 in extension.
Comment: MACD is in the positive territory and Pairs above its 20MA & 55MA.
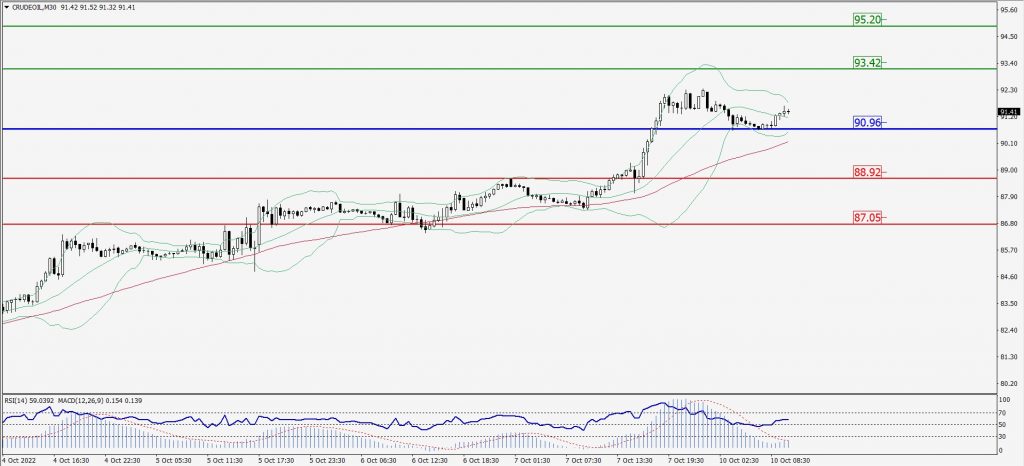
Green Lines Indicate Resistance Levels – Red Lines Indicate Support Levels
Light Blue is a Pivot Point – Black represents the price when the report was produced
XAU/USD Intraday: Resistance level at 1690.70
Our pivot point is 1790.70
Preferable Price Action: Further downside to 1677.00 and 1668.60
Alternative Price Action: If the price gives an upside breakout of a pivot, then the price extends to 1700.90 and 1710.20.
Comment: MACD is negative territory and Pairs below its 20MA & 55MA.
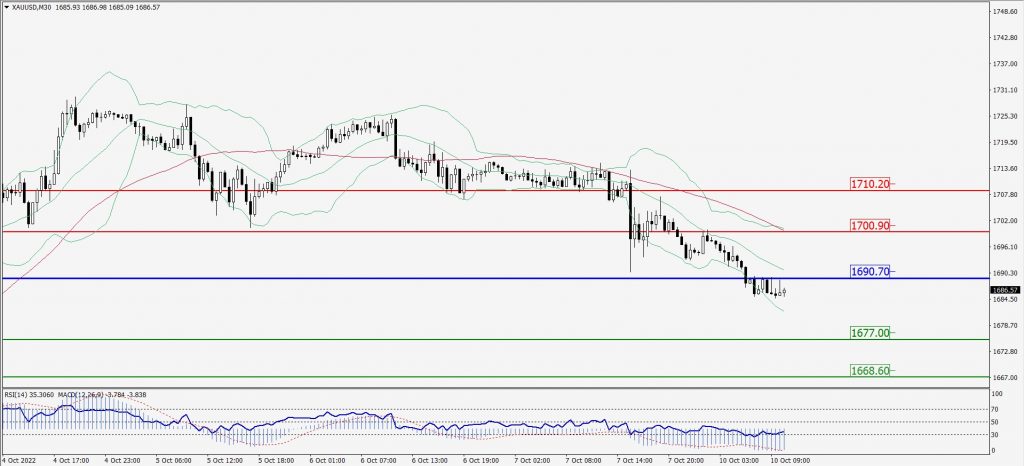
Green Lines Indicate Resistance Levels – Red Lines Indicate Support Levels
Light Blue is a Pivot Point – Black represents the price when the report was produced
Dow Jones Intraday: In a consolidation zone
Our pivot point is 29,414.00
Preferable Price Action: Take sell positions below pivot with targets at 29,065.00 & 28,804.00.
Alternative Price Action: Above 29,414.00 looks for further upside to 29,732.00 & 30,003.00.
Comment: RSI at 50 levels and Pairs below 55MA.
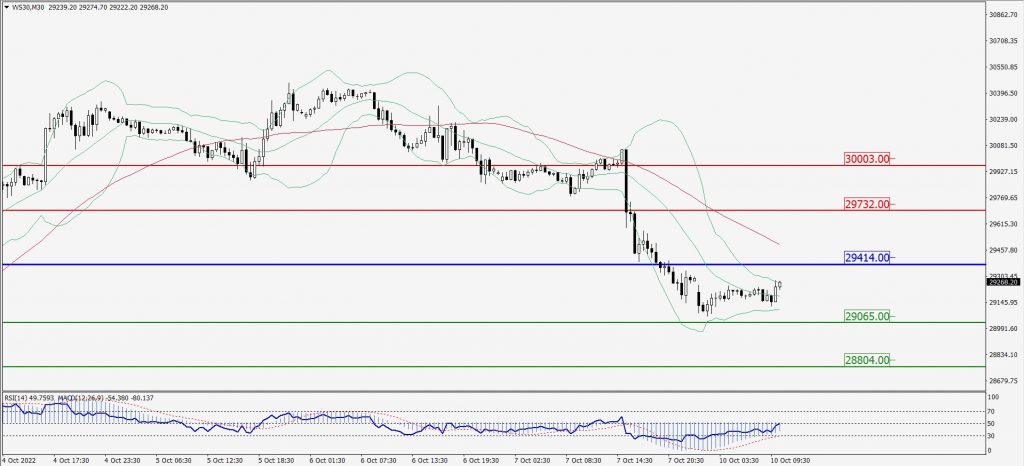
Green Lines Indicate Resistance Levels – Red Lines Indicate Support Levels
Light Blue is a Pivot Point – Black represents the price when the report was produced