Market Wrap: Stocks, Bonds, Commodities
US stocks fell on Monday, with the Nasdaq posting its lowest close since July 2020, as investors worried about the impact of higher interest rates and pulled out of chipmakers after the United States announced restrictions aimed at hobbling China’s semiconductor industry.
The Dow Jones Industrial Average fell 93.91 points to 29,202.88, the S&P 500 lose 27.27 points to 3,612.39 and the Nasdaq Composite subtract 110.30 points to 10,542.10.
MSCI’s index of Asia-Pacific stocks outside Japan is drop 2.18% to 547.65 levels. Australian index lower 0.34% to 6,645.00. Japanese Nikkei Index drop 2.64% to 26,401.25.
European stocks were negative on Tuesday, with the Stoxx Europe 50 Index fell 0.47% to 3,341.15, Germany’s DAX drop 0.47% to 12,214.75, and France’s CAC down 0.38% to 5,818.35, and U.K.’s FTSE 100 slipped 0.59% to 6,917.55.
Benchmark 10-year U.S. Treasury fell as demand for safe assets ascend again, today 10-year bond yields a positive 1.33% to 3.9370.
Oil prices fell on Tuesday, extending nearly 2% losses in the previous session, as a stronger US dollar and a flare-up in Covid-19 cases in China increased fears of slowing global demand.
Spot Brent crude oil subtract 1.14% to $95.09 per barrel. US West Texas Intermediate crude is down 1.36% to $89.89 a barrel.
The yellow metal gold is advance 0.03% to 1,675.50 dollars per ounce.
Market Wrap: Forex
The dollar hit multi-year highs on Tuesday against the risk-sensitive Aussie and Kiwi dollars and the yen hovered near the level that prompted intervention as worries about rising interest rates and geopolitical tensions unsettled investors.
Today, the U.S. dollar index measures the Greenback against a trade-weighted basket of six major currencies, which is fell 0.05% to 113.010.
The Euro US Dollar (EUR/USD) is a widely traded pair that is up 0.16% today. This left the pair trading around $0.97180.
The Japanese yen was positive against the U.S. dollar on Tuesday as the stock up. Today USD/JPY is drop 0.09% to 145.520 level.
Another commodity-related currency mixed against the U.S dollar, AUD/USD slipped 0.29% to 0.62850, and NZD/USD add 0.12 to 0.55730 level.
EUR/USD Intraday: Support level at 0.96920
Our pivot point is at 0.96920
Preferable Price Action: Take buy positions above pivot level with targets at 0.97670 & 0.98190 in extension.
Alternative Price Action: Below pivot looks for a further downside to 0.96320 & 0.95810.
Comment: RSI above 50 levels and Pairs above its 20MA & 55MA.
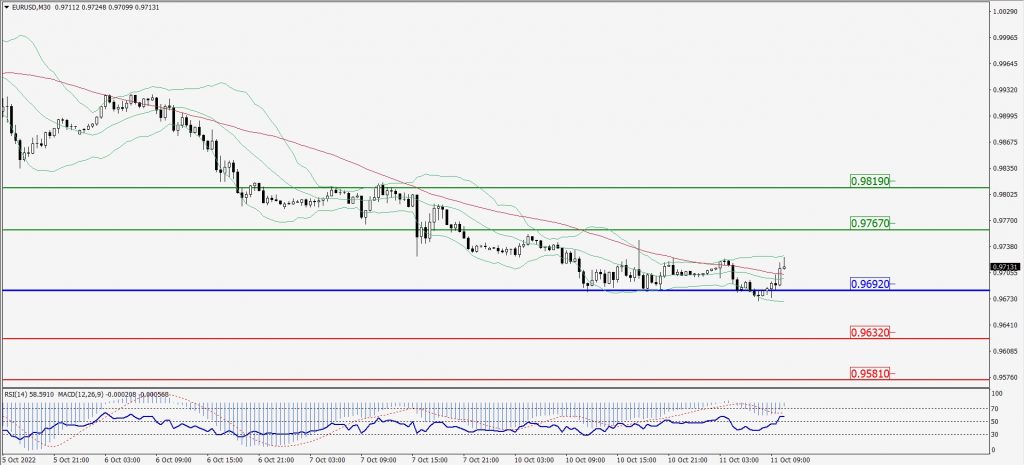
Green Lines Indicate Resistance Levels – Red Lines Indicate Support Levels
Light Blue is a Pivot Point – Black represents the price when the report was produced
GBP/USD Intraday: Trend on the downside
Our pivot point is at 1.10770
Preferable Price Action: Sell positions below pivot with targets at 1.09840 & 1.09090 in extension.
Alternative Price Action: The price above pivot would call for further upside to 1.11580 & 1.12270.
Comment: RSI below 50 levels and Pairs below its 20MA & 55MA.
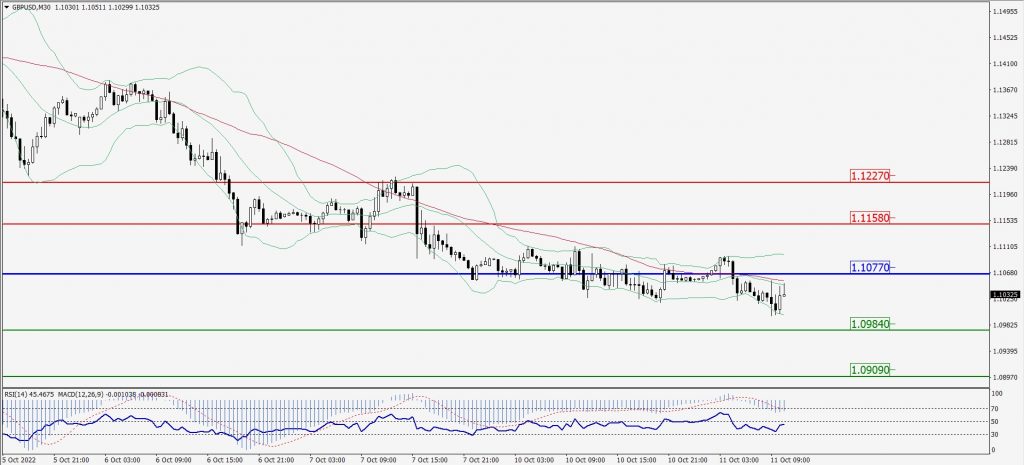
Green Lines Indicate Resistance Levels – Red Lines Indicate Support Levels
Light Blue is a Pivot Point – Black represents the price when the report was produced
USD/JPY Intraday: Resistance level at 145.820
Our pivot point is at 145.820
Preferable Price Action: Sell position below pivot with the target at 145.420 and 145.140 in extension.
Alternative Price Action: The upside breakout of the pivot would call for 146.140 and 146.400.
Comment: MACD is negative territory and Pairs below 20MA.
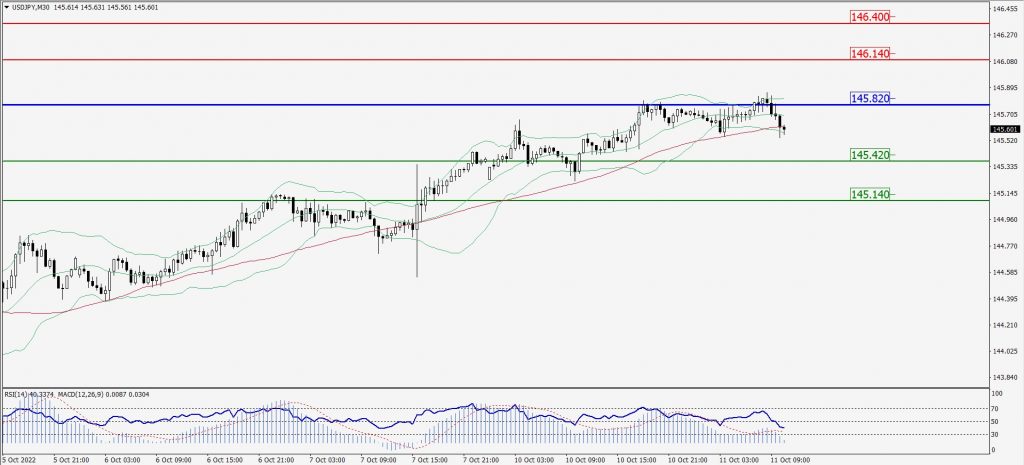
Green Lines Indicate Resistance Levels – Red Lines Indicate Support Levels
Light Blue is a Pivot Point – Black represents the price when the report was produced
AUD/USD Intraday: Trend on the downside
Our pivot point is at 0.63100
Preferable Price Action: Sell Positions below pivot with targets at 0.62440 & 0.61890 in extension.
Alternative Price Action: Above pivot looks for a further upside with 0.63730 & 0.64250 as targets.
Comment: RSI below 50 levels and Pairs below 55MA.
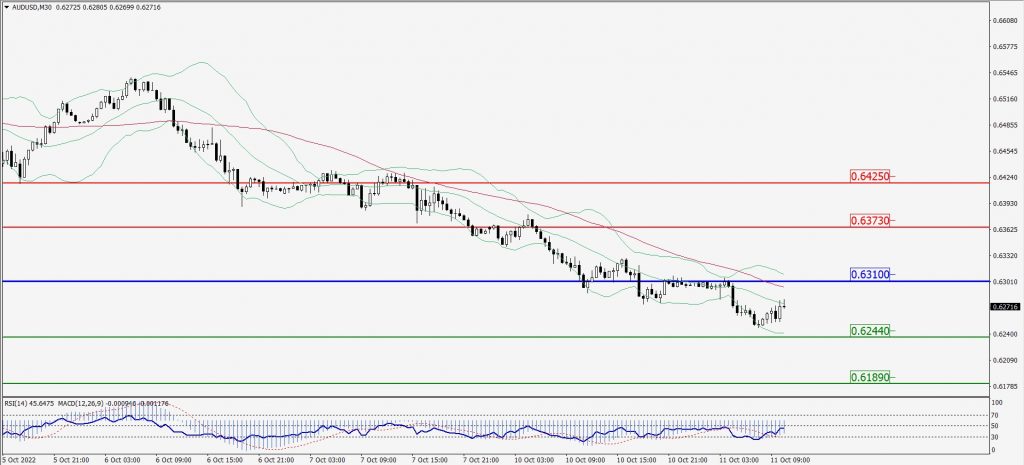
Green Lines Indicate Resistance Levels – Red Lines Indicate Support Levels
Light Blue is a Pivot Point – Black represents the price when the report was produced
CRUDEOIL Intraday: Trend on the downside
Our pivot point is at 90.50
Preferable Price Action: Below pivots sell oil with 88.07 & 86.40 as targets.
Alternative Price Action: Buy crude above pivot with targets at 93.25 and 95.00 in extension.
Comment: MACD is in the negative territory and Pairs below its 20MA & 55MA.
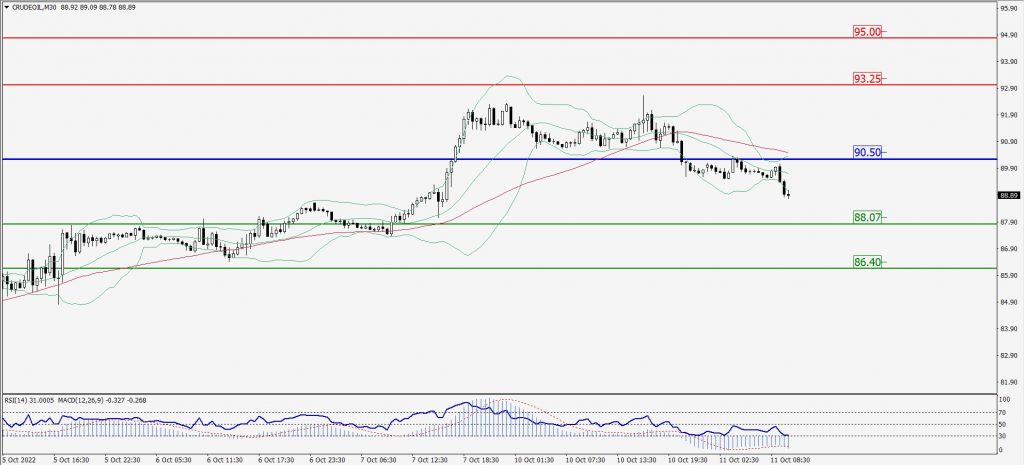
Green Lines Indicate Resistance Levels – Red Lines Indicate Support Levels
Light Blue is a Pivot Point – Black represents the price when the report was produced
XAU/USD Intraday: Major trend on the downside
Our pivot point is 1673.80
Preferable Price Action: Further downside to 1658.00 and 1647.10
Alternative Price Action: If the price gives an upside breakout of a pivot, then the price extends to 1686.30 and 1697.30.
Comment: MACD is negative territory and Pairs below its 20MA & 55MA.
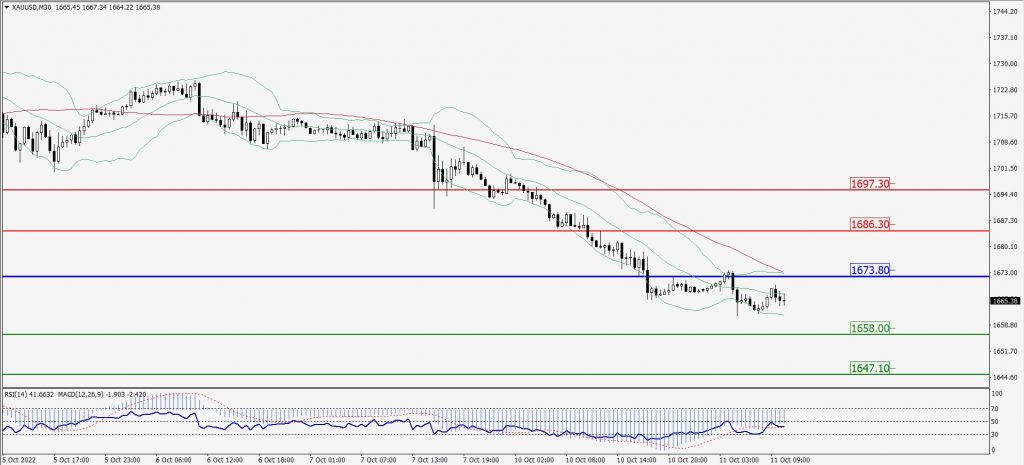
Green Lines Indicate Resistance Levels – Red Lines Indicate Support Levels
Light Blue is a Pivot Point – Black represents the price when the report was produced
Dow Jones Intraday: Trend on the downside
Our pivot point is 29,247.00
Preferable Price Action: Take sell positions below pivot with targets at 28,798.00 & 28,515.00.
Alternative Price Action: Above 29,247.00 looks for further upside to 29,610.00 & 29,944.00.
Comment: RSI below 50 levels and Pairs below its 20MA & 55MA.
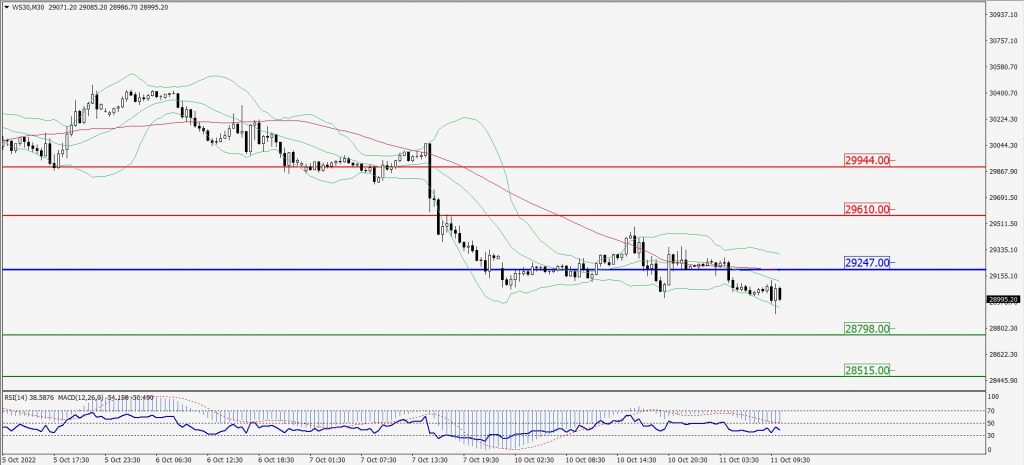
Green Lines Indicate Resistance Levels – Red Lines Indicate Support Levels
Light Blue is a Pivot Point – Black represents the price when the report was produced