Market Wrap: Stocks, Bonds, Commodities
Wall Street’s major indexes closed lower on Thursday as concerns mounted ahead of closely watched monthly nonfarm payrolls numbers due on Friday that the Federal Reserve’s aggressive interest rate stance will lead to a recession.
The Dow Jones Industrial Average fell 346.93 points to 29,926.94, the S&P 500 lose 38.76 points to 3,744.52 and the Nasdaq Composite subtract 75.33 points to 11,073.31.
MSCI’s index of Asia-Pacific stocks outside Japan is ascend 1.43% to 569.23 levels. Australian index lower 0.80% to 6,762.80. Japanese Nikkei Index drop 0.71% to 27,116.11.
European stocks were mixed on Friday, with the Stoxx Europe 50 Index fell 0.27% to 3,424.15, Germany’s DAX drop 0.17% to 12,449.02, and France’s CAC up 0.01% to 5,936.89, and U.K.’s FTSE 100 slipped 0.11% to 6,998.38.
Benchmark 10-year U.S. Treasury fell as demand for safe assets ascend again, today 10-year bond yields a positive 0.39% to 3.8390.
Oil prices rose on Friday, continuing an upward trend after OPEC+ this week agreed to tighten global supply with a deal to cut production targets by 2 million barrels per day (bpd).
Spot Brent crude oil add 0.25% to $94.66 per barrel. US West Texas Intermediate crude is up 0.24% to $88.66 a barrel.
The yellow metal gold is decline 0.03% to 1,720.10 dollars per ounce.
Market Wrap: Forex
The dollar rose on Thursday, climbing for a second straight session, as investors bet on another strong U.S. non-farm payrolls report that should keep the Federal Reserve on an aggressive tightening path for some time.
Today, the U.S. dollar index measures the Greenback against a trade-weighted basket of six major currencies, which is fell 0.14% to 112.040.
The Euro US Dollar (EUR/USD) is a widely traded pair that is up 0.15% today. This left the pair trading around $0.98020.
The Japanese yen was positive against the U.S. dollar on Friday as the stock up. Today USD/JPY is drop 0.13% to 144.930 level.
Another commodity-related currency mixed against the U.S dollar, AUD/USD surged 0.20% to 0.64150, and NZD/USD subtract 0.02 to 0.56550 level.
EUR/USD Intraday: Resistance level at 0.98120
Our pivot point is at 0.98120
Preferable Price Action: Take sell positions below pivot level with targets at 0.97420 & 0.96910 in extension.
Alternative Price Action: Above pivot looks for a further upside to 0.98670 & 0.99210.
Comment: RSI below 50 levels and Pairs below its 20MA & 55MA.
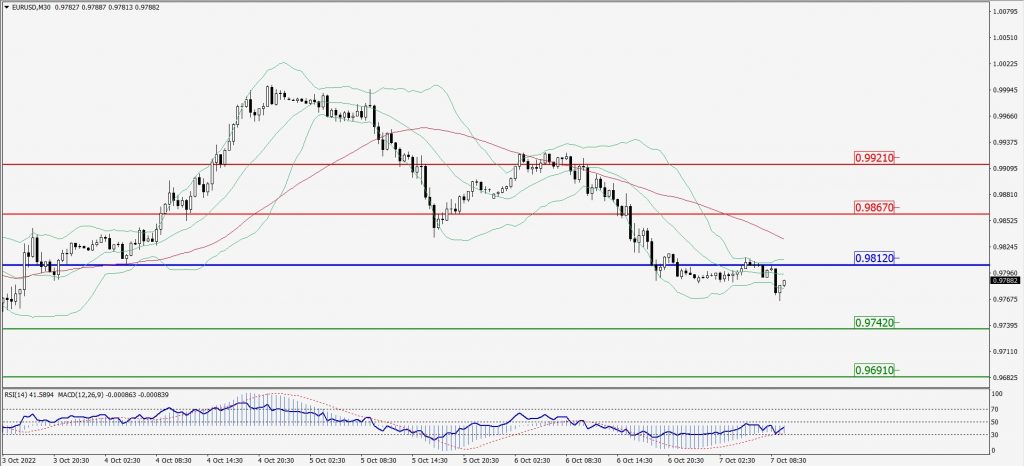
Green Lines Indicate Resistance Levels – Red Lines Indicate Support Levels
Light Blue is a Pivot Point – Black represents the price when the report was produced
GBP/USD Intraday: Trend on the downside
Our pivot point is at 1.11990
Preferable Price Action: Sell positions below pivot with targets at 1.10880 & 1.10070 in extension.
Alternative Price Action: The price above pivot would call for further upside to 1.12930 & 1.13780.
Comment: RSI below 50 levels and Pairs below its 20MA & 55MA.
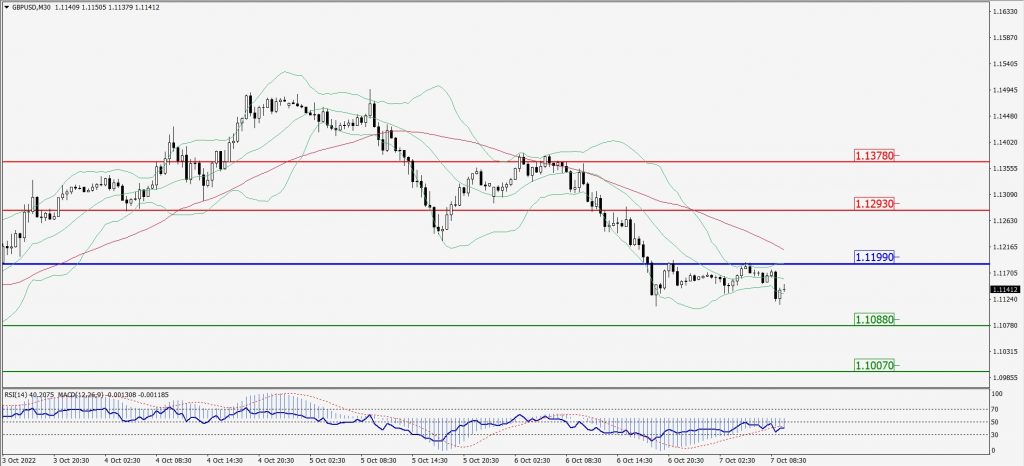
Green Lines Indicate Resistance Levels – Red Lines Indicate Support Levels
Light Blue is a Pivot Point – Black represents the price when the report was produced
USD/JPY Intraday: Trend on the upside
Our pivot point is at 144.960
Preferable Price Action: Buy position above pivot with the target at 145.390 and 145.740 in extension.
Alternative Price Action: The downside breakout of the pivot would call for 144.580 and 144.260.
Comment: MACD is positive territory and Pairs above 55MA.
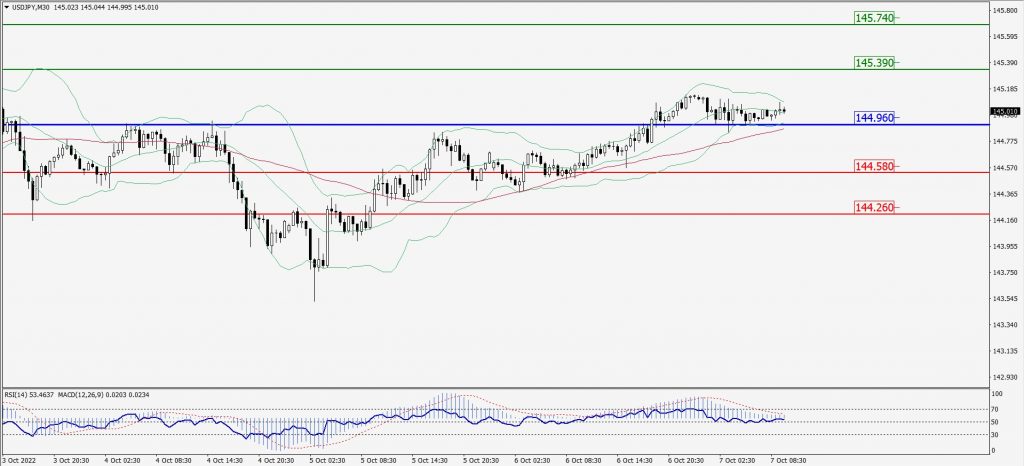
Green Lines Indicate Resistance Levels – Red Lines Indicate Support Levels
Light Blue is a Pivot Point – Black represents the price when the report was produced
AUD/USD Intraday: Trend on the downside
Our pivot point is at 0.64200
Preferable Price Action: Sell Positions below pivot with targets at 0.63670 & 0.63280 in extension.
Alternative Price Action: Above pivot looks for a further upside with 0.64630 & 0.65000 as targets.
Comment: RSI below 50 levels and Pairs below its 20MA & 55MA.
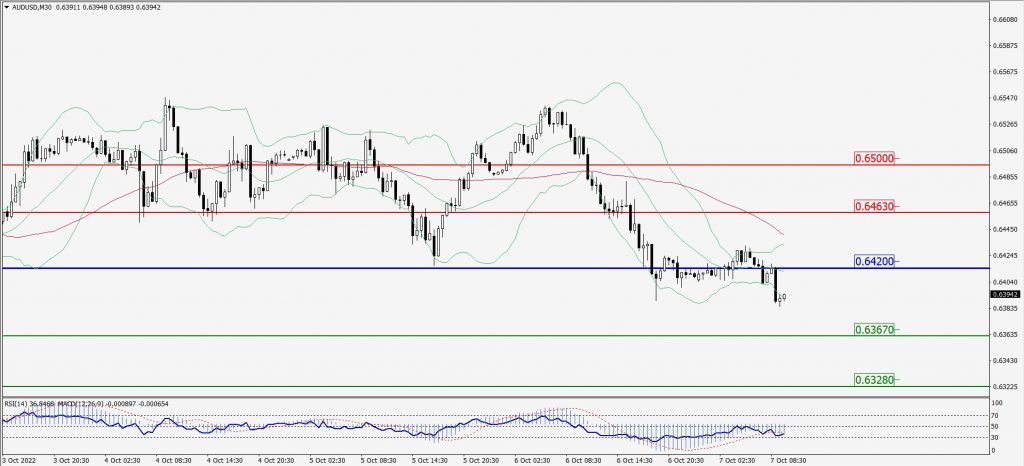
Green Lines Indicate Resistance Levels – Red Lines Indicate Support Levels
Light Blue is a Pivot Point – Black represents the price when the report was produced
CRUDEOIL Intraday: Support level at 87.67
Our pivot point is at 87.67
Preferable Price Action: Above pivots buy oil with 89.99 & 92.08 as targets.
Alternative Price Action: Sell crude below pivot with targets at 85.47 and 83.64 in extension.
Comment: MACD is in the positive territory and Pairs above 55MA.
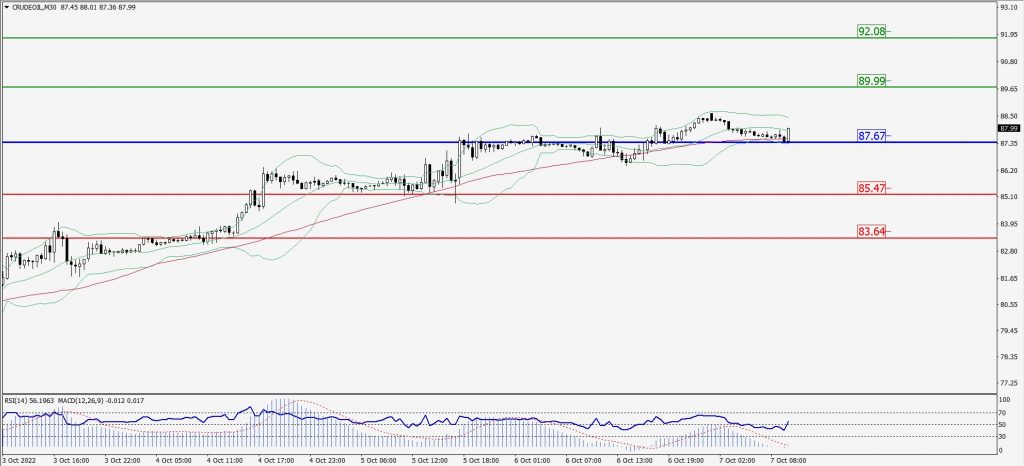
Green Lines Indicate Resistance Levels – Red Lines Indicate Support Levels
Light Blue is a Pivot Point – Black represents the price when the report was produced
XAU/USD Intraday: In a consolidation zone
Our pivot point is 1716.90
Preferable Price Action: Further downside to 1702.90 and 1691.80
Alternative Price Action: If the price gives an upside breakout of a pivot, then the price extends to 1729.90 and 1742.30.
Comment: MACD is negative territory and Pairs below 55MA.
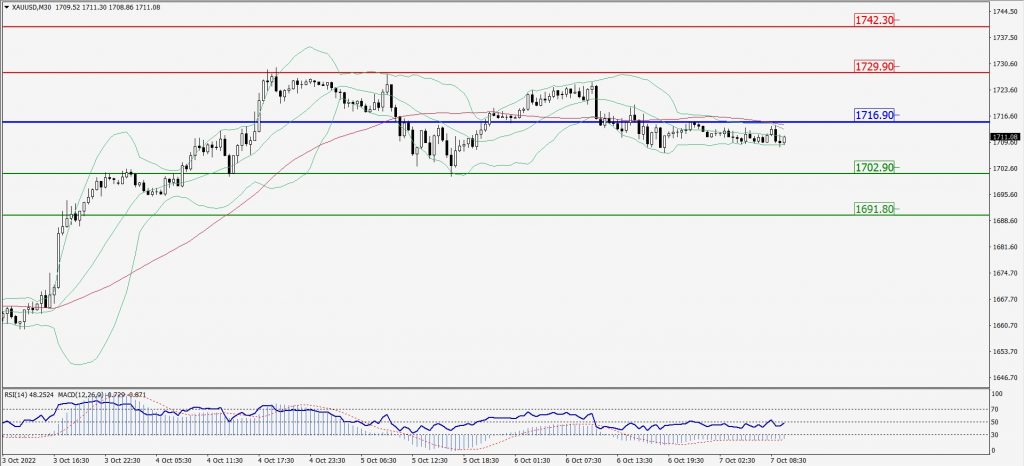
Green Lines Indicate Resistance Levels – Red Lines Indicate Support Levels
Light Blue is a Pivot Point – Black represents the price when the report was produced
Dow Jones Intraday: In a consolidation zone
Our pivot point is 30,090.00
Preferable Price Action: Take sell positions below pivot with targets at 29,708.00 & 29,430.00.
Alternative Price Action: Above 30,090.00 looks for further upside to 30,406.00 & 30,672.00.
Comment: RSI below 50 levels and Pairs below 55MA.
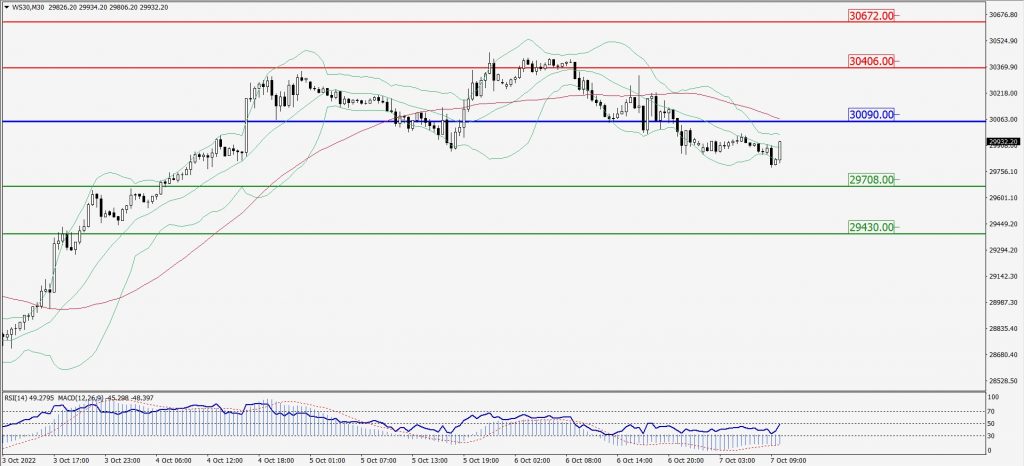
Green Lines Indicate Resistance Levels – Red Lines Indicate Support Levels
Light Blue is a Pivot Point – Black represents the price when the report was produced