Market Wrap: Stocks, Bonds, Commodities
Australia stocks were lower after the close on Monday, as losses in the A-REITs, Gold, and IT sectors led shares lower.
The S&P 500 lose (0.57%) ended at 4,123.34 points, while the Nasdaq Composite down 1.40% to 12,144.66. The Dow Jones Industrial was fell 0.30% to 32,899.37.
MSCI’s index of Asia-Pacific stocks outside Japan is drop 1.03% to 650.10 levels. Australian index lower 1.18% to 7,120.70. Japanese Nikkei Index drop 2.53% to 26,319.34.
European stocks were negative on Monday, with the Stoxx Europe 50 Index lose 0.99% to 3,593.25, Germany’s DAX drop 0.68% to 13,580.07, and France’s CAC down 0.93% to 6,200.20, and U.K.’s FTSE 100 decrease 0.73% to 7,332.77.
Benchmark 10-year U.S. Treasury fell as demand for safe assets ascend again, today 10-year bond yields a positive 3.1790.
Oil declined as the week’s trading kicked off as investors weighed a pledge by the Group of Seven to ban imports of Russian crude against a cut in official prices by Saudi Arabia and China’s lockdowns.
Spot Brent crude oil fell 0.49% to $111.84 per barrel. US West Texas Intermediate crude is down 0.72% to $109.00 a barrel.
The yellow metal gold is decline 0.59% to 1,870.79 dollars per ounce.
Market Wrap: Forex
The European Union should seize Russia’s foreign exchange reserves to pay for the reconstruction of Ukraine, the EU’s top diplomat said in an interview published on Monday.
Today, the U.S. dollar index measures the Greenback against a trade-weighted basket of six major currencies, which is a rose of 0.34% to 104.047.
The Euro US Dollar (EUR/USD) is a widely traded pair that is down 0.37% today. This left the pair trading around $1.05140.
The Japanese yen was positive against the U.S. dollar on Monday as the stock up. Today USD/JPY is rose 0.45% to 131.150 level.
Another commodity-related currency negative against the U.S dollar, AUD/USD drop 0.96 to 0.70090, and NZD/USD lower 0.98% to 0.63450 level.
EUR/USD Intraday: Trend on The Downside
Our pivot point is at 1.05290
Preferable Price Action: Take Sell positions below pivot level with targets at 1.04400 & 1.03640 in extension.
Alternative Price Action: Above pivot looks for a further upside to 1.06220 & 1.07040.
Comment: RSI Below 50 levels and Pair below its 20MA & 55MA.
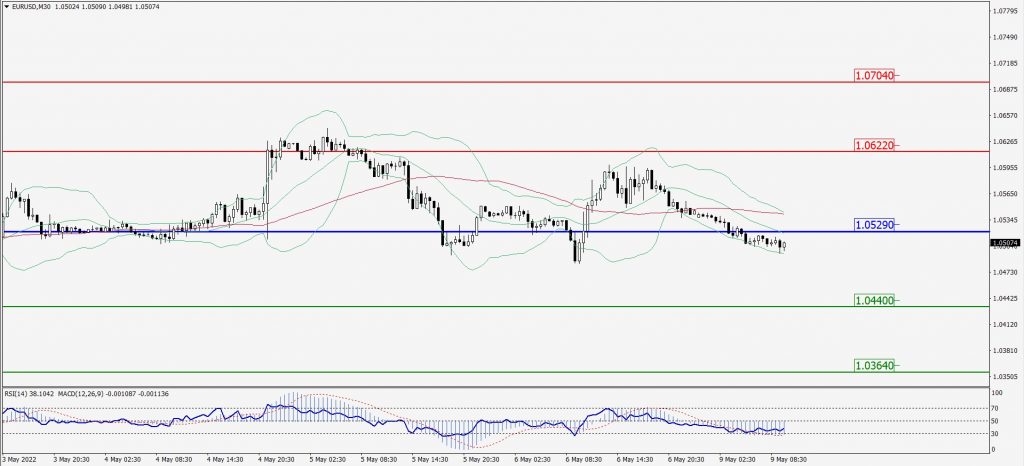
Green Lines Indicate Resistance Levels – Red Lines Indicate Support Levels
Light Blue is a Pivot Point – Black represents the price when the report was produced
GBP/USD Intraday: Major Trend on The Downside
Our pivot point is at 1.23400
Preferable Price Action: Sell positions below pivot with targets at 1.21450 & 1.20400 in extension.
Alternative Price Action: The price above pivot would call for further upside to 1.25110 & 1.26700.
Comment: RSI below 50 levels pair below its 20MA & 55MA.
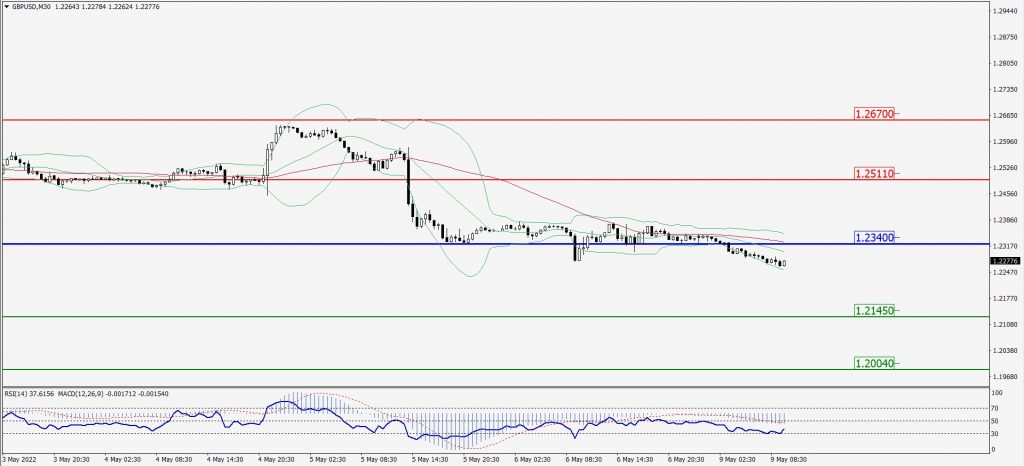
Green Lines Indicate Resistance Levels – Red Lines Indicate Support Levels
Light Blue is a Pivot Point – Black represents the price when the report was produced
USD/JPY Intraday: Trend on The Upside
Our pivot point is at 130.900
Preferable Price Action: Buy position above pivot with the target at 132.520 and 133.670 in extension.
Alternative Price Action: The downside breakout of the pivot would call for 129.310 and 128.030.
Comment: MACD is positive territory and pair above its 20MA & 55MA.
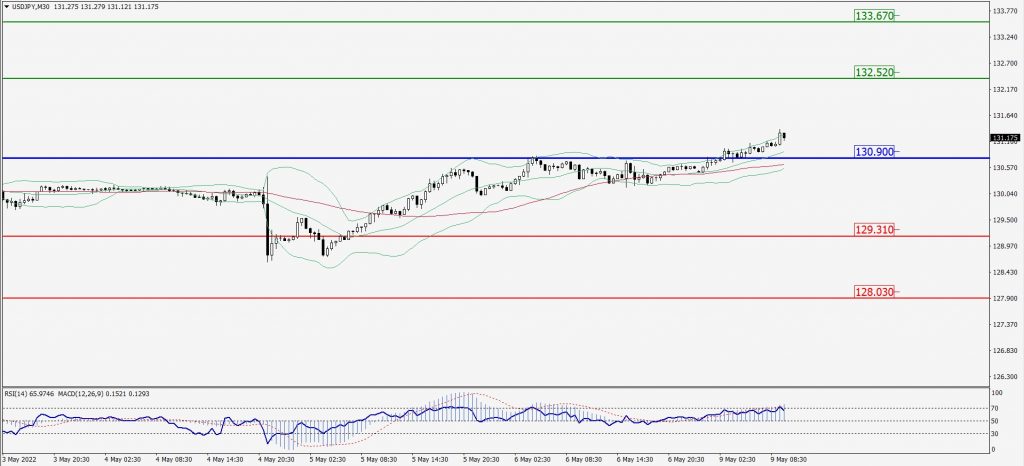
Green Lines Indicate Resistance Levels – Red Lines Indicate Support Levels
Light Blue is a Pivot Point – Black represents the price when the report was produced
AUD/USD Intraday: Trend on The Downside
Our pivot point is at 0.70600
Preferable Price Action:Sell Positions below pivot with targets at 0.69170 & 0.68190 in extension.
Alternative Price Action: Above pivot looks for a further upside with 0.71980 & 0.73100 as targets.
Comment: RSI below 50 levels and Pair below its 20MA & 55MA.
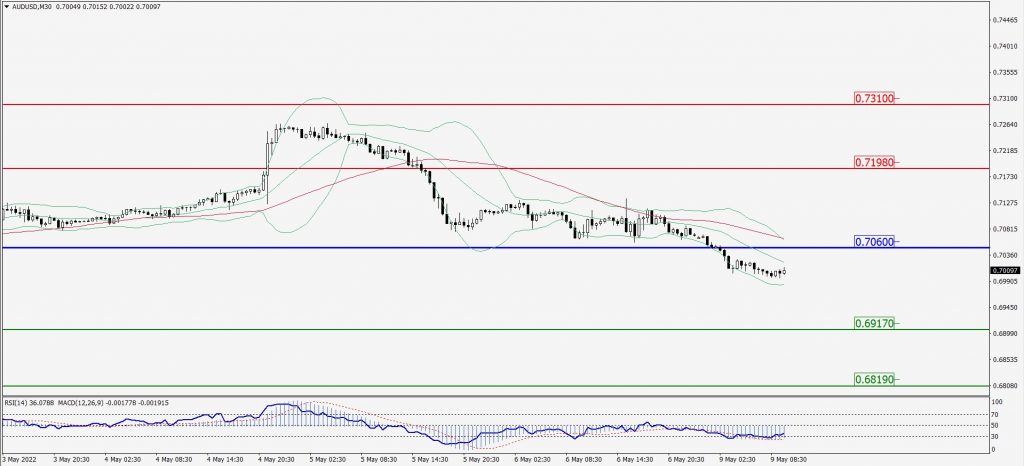
Green Lines Indicate Resistance Levels – Red Lines Indicate Support Levels
Light Blue is a Pivot Point – Black represents the price when the report was produced
CRUDEOIL Intraday: Major Resistance Level at 110.07
Our pivot point is at 110.07
Preferable Price Action: Below pivots sell oil with 104.47 & 100.06 as targets.
Alternative Price Action: Buy crude above pivot with targets at 114.92 and 118.78 in extension.
Comment: MACD is in the negative territory and Pair below its 20MA & 55MA.
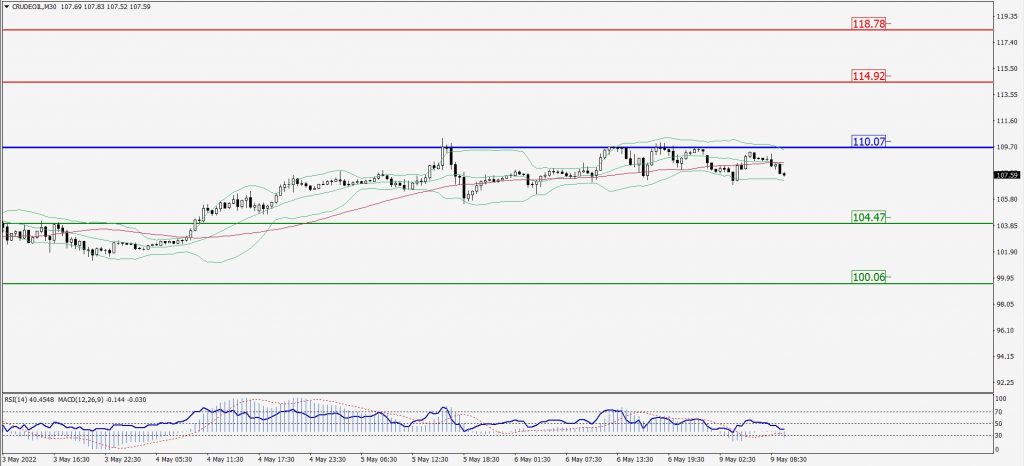
Green Lines Indicate Resistance Levels – Red Lines Indicate Support Levels
Light Blue is a Pivot Point – Black represents the price when the report was produced
XAU/USD Intraday: In a Consolidation Zone
Our pivot point is 1879.10
Preferable Price Action: Further downside to 1852.20 and 1829.80.
Alternative Price Action: If the price gives an upside breakout of a pivot, then the price extends to 1904.50 and 1924.50.
Comment: MACD is negative territory and Pair below its 20MA & 55MA.
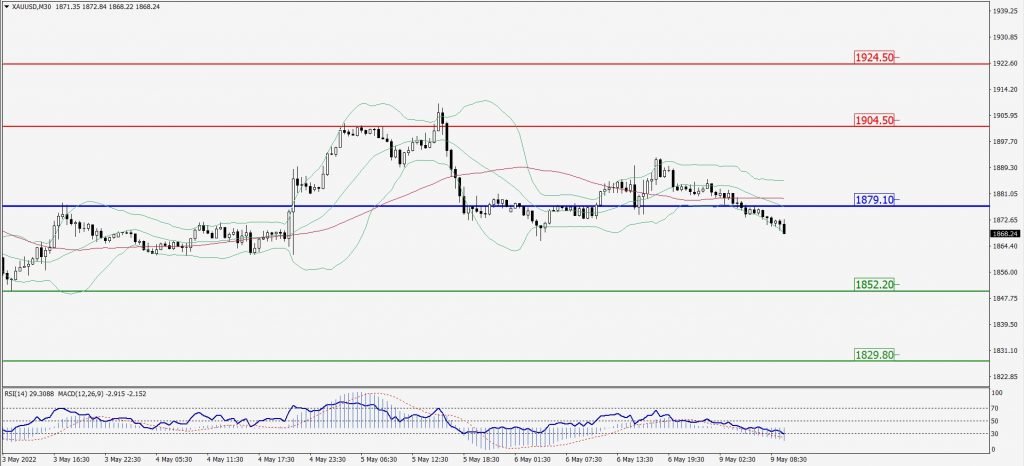
Green Lines Indicate Resistance Levels – Red Lines Indicate Support Levels
Light Blue is a Pivot Point – Black represents the price when the report was produced
Dow Jones Intraday: In a Consolidation Zone
Our pivot point is 32,995.00
Preferable Price Action: Take Sell positions below pivot with targets at 32,007.00 & 31,254.00.
Alternative Price Action: Below 32,995.00 looks for further upside to 33,855.00 & 35,545.00.
Comment: RSI below 50 levels and pair below its 20MA & 55MA.
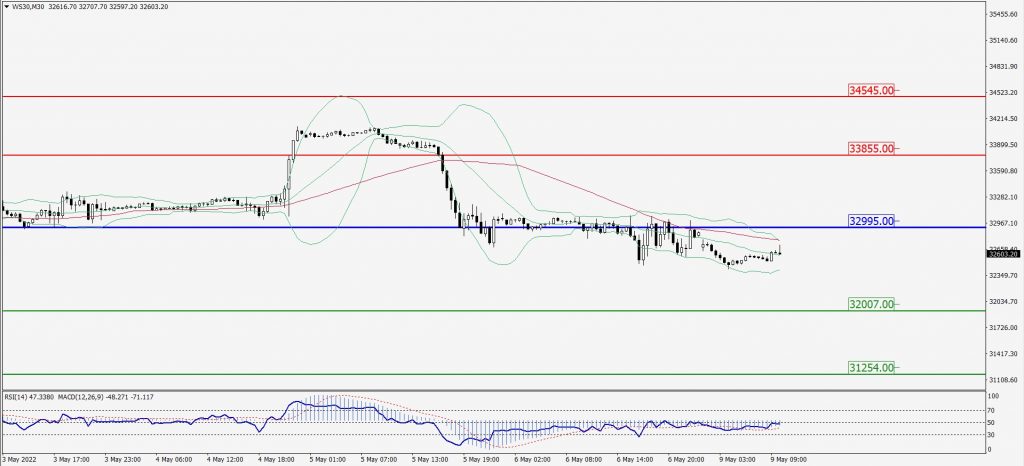
Green Lines Indicate Resistance Levels – Red Lines Indicate Support Levels
Light Blue is a Pivot Point – Black represents the price when the report was produced