Market Wrap: Stocks, Bonds, Commodities
Wall Street’s main indexes were mixed in choppy trading on Monday after data pointed to weaker-than-expected job growth last month, further fuelling bets of an aggressive monetary policy tightening by the Federal Reserve.
The S&P 500 loose (0.41%) to end at 4,677.02 points, while the Nasdaq Composite lost 145.0 points (0.96%) to 14,935.90. The Dow Jones Industrial flat to 36,231.66.
MSCI’s index of Asia-Pacific stocks outside Japan rose 0.63%, to 789.81 levels. Australian index down 0.08% to 7,4547.10. Japanese Nikkei Index down 0.03% to 28,478.56.
European stocks were negative on Monday, with the Stoxx Europe 50 Index left 0.26% to 4,294.52, Germany’s DAX stair down 0.37% to 15,888.33, and France’s CAC lost 0.27% to 7,200.22, and U.K.’s FTSE 100 losed 0.15% to 7,474.20.
Benchmark 10-year U.S. Treasury ascend as demand for safe assets Gain again, today 10-year bond yields up at 1.41% to 1.749.
Oil lost more ground on Monday as rapidly climbing cases of the Omicron COVID-19 variant hit economic activity, although losses were curbed by supply disruptions in Kazakhstan and Libya.
Spot Brent crude oil collected 0.04% to $81.78 per barrel. US West Texas Intermediate crude up to $78.97 a barrel.
The yellow metal gold is fell 0.09% to 1,789.40 dollars per ounce.
Market Wrap: Forex
The dollar started the week with support as traders bet U.S. inflation data and appearances from several Federal Reserve officials would bolster the case for higher interest rates.
Today, the U.S. dollar index measures the greenback against a trade-weighted basket of six major currencies, which is up 0.22% to 95.930.
The Euro US Dollar (EUR/USD) is a widely traded pair that is fell today. This left the pair trading around $1.13370.
The Japanese yen rise against the U.S. dollar on Monday as the stock pushes the upper. Today US/JPY is gained 0.10% to 115.670 level.
Another commodity-related currency mixed against the U.S dollar, AUD/USD collected 0.17% to 0.71900, and NZD/USD fell 0.123% to 0.67710 level.
EUR/USD Intraday: Support at 1.13100
Our pivot point is at 1.13100
Preferable Price Action: Take Long positions above pivot level with targets at 1.13560 & 1.13930 in extension.
Alternative Price Action: Below pivot looks for a further Downside to 1.12660 & 1.12300.
Comment: Pair Below 20MA and RSI below 50 levels.
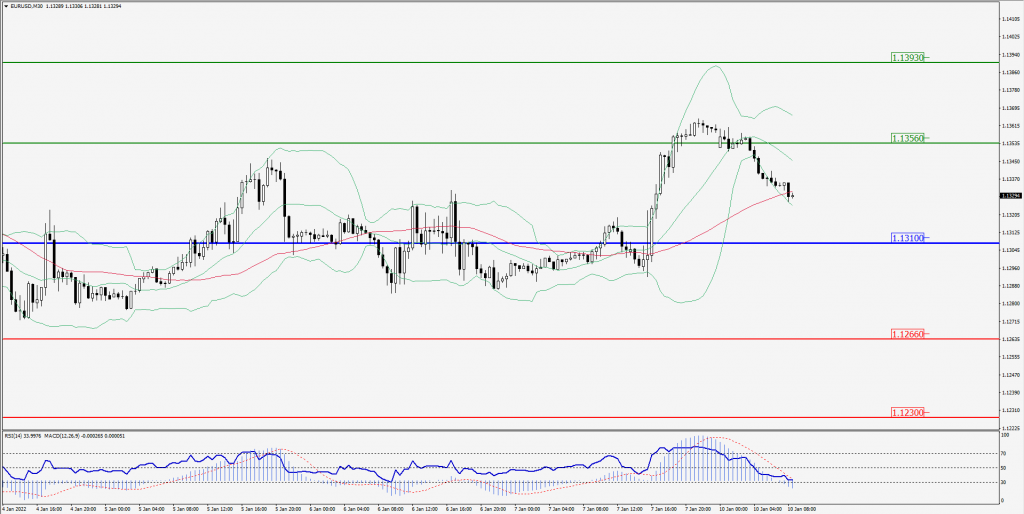
Green Lines Indicate Resistance Levels – Red Lines Indicates Support Levels
Light Blue is a Pivot Point – Black represents the price when the report was produced
GBP/USD Intraday: Major Support at 1.35630
Our pivot point is at 1.35630
Preferable Price Action: Buy positions Above pivot with targets at 1.36030 & 1.36300 in extension.
Alternative Price Action: The price Below pivot would call for further Downside to 1.35230 & 1.34930.
Comment: Pair Above 55MA and RSI at 50 levels.
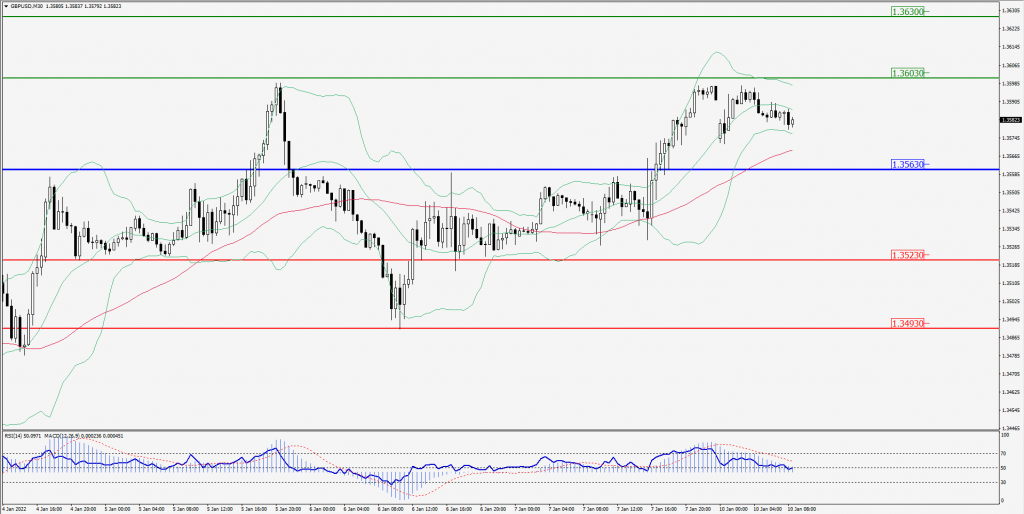
Green Lines Indicate Resistance Levels – Red Lines Indicates Support Levels
Light Blue is a Pivot Point – Black represents the price when the report was produced
USD/JPY Intraday: Trend on the major Downside
Our pivot point is at 115.960
Preferable Price Action: Sell position Below pivot with the target at 115.630 and 115.330 in extension.
Alternative Price Action: The Upside breakout of the pivot would call for 116.290 and 116.590.
Comment: MACD in Flat territory.
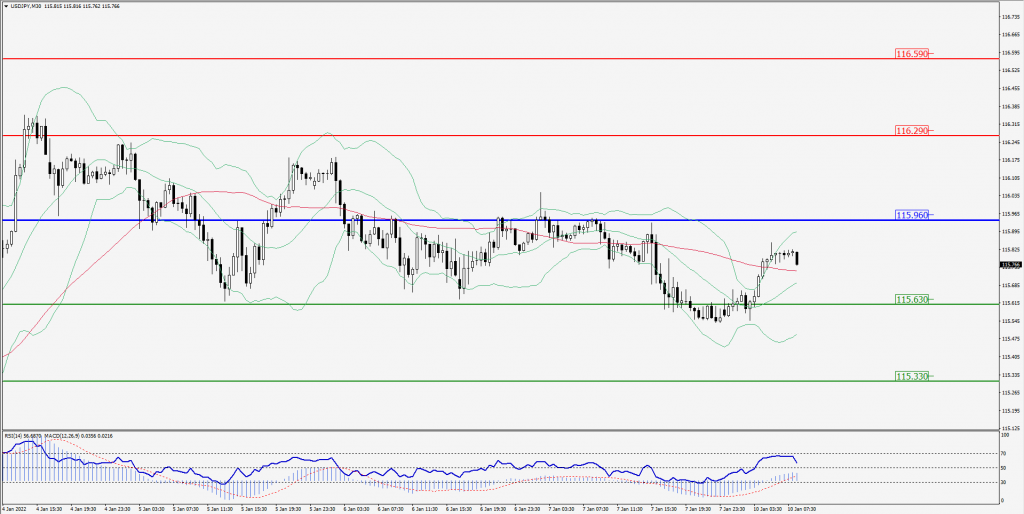
Green Lines Indicate Resistance Levels – Red Lines Indicates Support Levels
Light Blue is a Pivot Point – Black represents the price when the report was produced
AUD/USD Intraday: Trend on the upside
Our pivot point is at 0.71690
Preferable Price Action: Buy Positions Above pivot with targets at 0.72160 & 0.72530 in extension.
Alternative Price Action: Below pivot looks for a further Downside with 0.71230 & 0.70830 as targets.
Comment: Pair above its 20MA & 55MA and RSI above 50 levels.
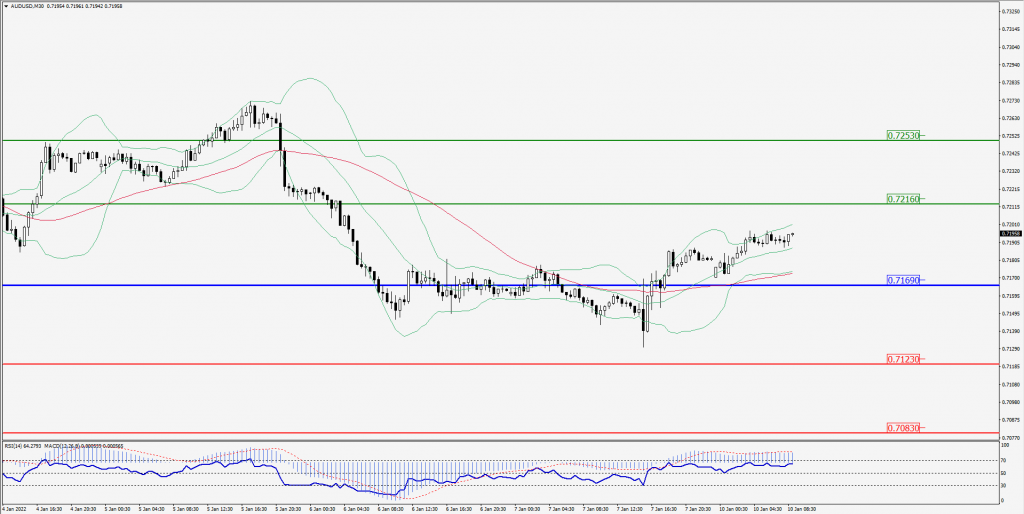
Green Lines Indicate Resistance Levels – Red Lines Indicates Support Levels
Light Blue is a Pivot Point – Black represents the price when the report was produced
CRUDEOIL Intraday: Support at 77.60
Our pivot point is at 77.60
Preferable Price Action: Above pivots Buy Oil with 79.90 & 81.60 as targets.
Alternative Price Action: Sell crude Below pivot with targets at 75.60 and 73.90 in extension.
Comment: Price Above 20MA and MACD is in the flat territory.
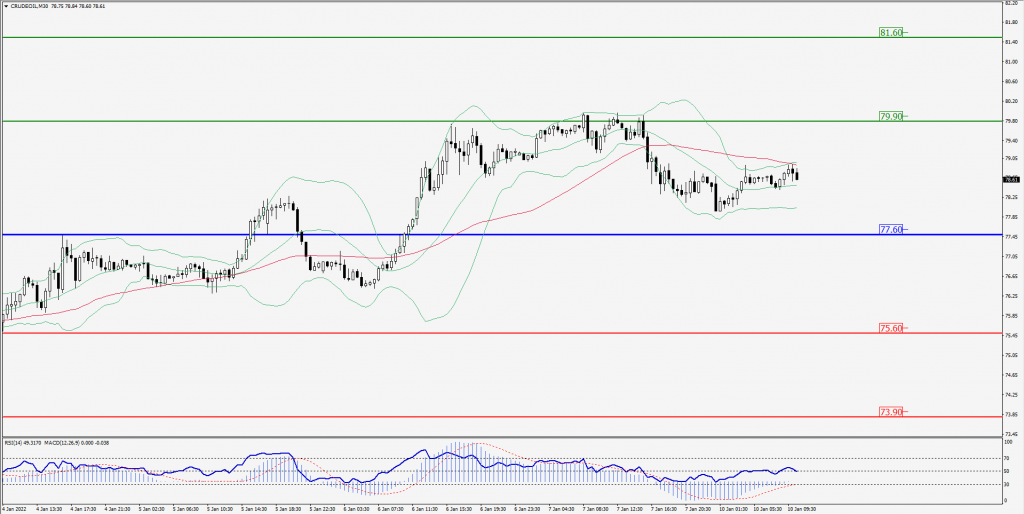
Green Lines Indicate Resistance Levels – Red Lines Indicates Support Levels
Light Blue is a Pivot Point – Black represents the price when the report was produced
XAU/USD Intraday: Major Down Trend
Our pivot point is 1800.00
Preferable Price Action: Further Downside to 1786.00 and 1773.60.
Alternative Price Action: If the price gives an Upside breakout of a pivot, then the price extends to 1813.60 and 1826.30.
Comment: MACD is in negative territory and the price is below 20MA.
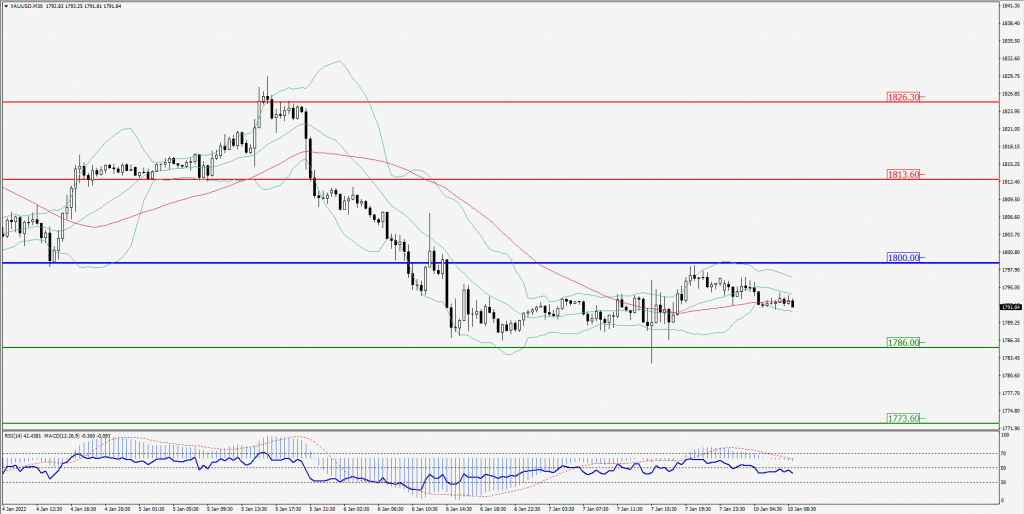
Green Lines Indicate Resistance Levels – Red Lines Indicates Support Levels
Light Blue is a Pivot Point – Black represents the price when the report was produced
Dow Jones Intraday: Trend on the Downside
Our pivot point is 36,369.00
Preferable Price Action: Take Short positions Below pivot with targets at 36,160.00 & 35,990.00.
Alternative Price Action: Above 36,490.00 looks for further Upside to 36,590.00 & 36,760.00.
Comment: RSI Above 50 levels And price is Above 20MA.
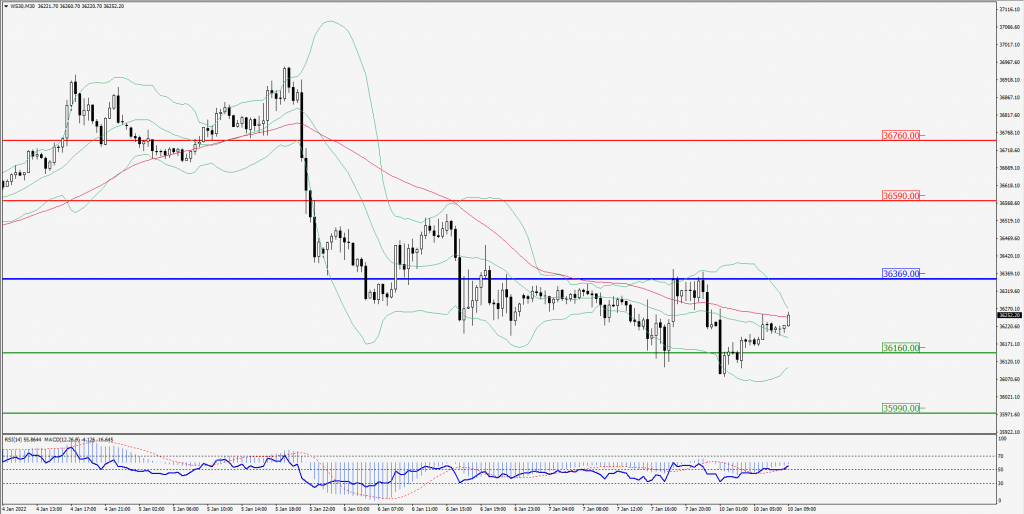
Green Lines Indicate Resistance Levels – Red Lines Indicates Support Levels
Light Blue is a Pivot Point – Black represents the price when the report was produced