Market Wrap: Stocks, Bonds, Commodities
Wall Street’s three major indexes staged a late-session comeback on Tuesday as the Nasdaq managed to eke out a tiny gain and investors swooped in to hunt for bargains, while the S&P 500 and the Dow Jones Industrial Average finished well above their session lows.
The S&P 500 loose (0.14%) to end at 4,670.29 points, while the Nasdaq Composite gain 6.9 points (0.05%) to 14,942.80. The Dow Jones Industrial fell (0.45%) to 36,068.87.
MSCI’s index of Asia-Pacific stocks outside Japan rose 0.25%, to 791.74 levels. Australian index down 0.77% to 7,390.10. Japanese Nikkei Index down 0.90% to 28,222.48.
European stocks were negative on Tuesday, with the Stoxx Europe 50 Index gain 1.38% to 4,298.05 Germany’s DAX stair up 1.24% to 15,963.49, and France’s CAC advance 1.47% to 7,220.25, and U.K.’s FTSE 100 pull up 0.54% to 7,485.74.
Benchmark 10-year U.S. Treasury descend as demand for safe assets loose again, today 10-year bond yields down at 1.10% to 1.760.
Oil prices fell on Tuesday as concerns about demand fears stoked by the rapid global rise in Omicron coronavirus infections overtook concerns about oil supply reduction from Kazakhstan.
Spot Brent crude oil collected 0.83% to $81.54 per barrel. US West Texas Intermediate crude up to $78.98 a barrel.
The yellow metal gold is rose 0.53% to 1,808.25 dollars per ounce.
Market Wrap: Forex
The U.S. dollar hovered near the middle of its recent range against major peers on Tuesday as traders looked to incumbent Fed Chair Jerome Powell’s nomination hearing later in the day for new clues on the timing and pace of policy normalization.
Today, the U.S. dollar index measures the greenback against a trade-weighted basket of six major currencies, which is dropped 0.13% to 95.860.
The Euro US Dollar (EUR/USD) is a widely traded pair that is rose today. This left the pair trading around $1.13400.
The Japanese yen rise against the U.S. dollar on Tuesday as the stock pushes the upper. Today US/JPY is flat at 115.210 level.
Another commodity-related currency rise against the U.S dollar, AUD/USD collected 0.27% to 0.71880, and NZD/USD gain 0.28% to 0.67740 level.
EUR/USD Intraday: In Consolidation Zone
Our pivot point is at 1.13230
Preferable Price Action: Take Long positions above pivot level with targets at 1.13590 & 1.13900 in extension.
Alternative Price Action: Below pivot looks for a further Downside to 1.12890 & 1.12560.
Comment: Pair Above its 20MA & 55MA and RSI above 50 levels.
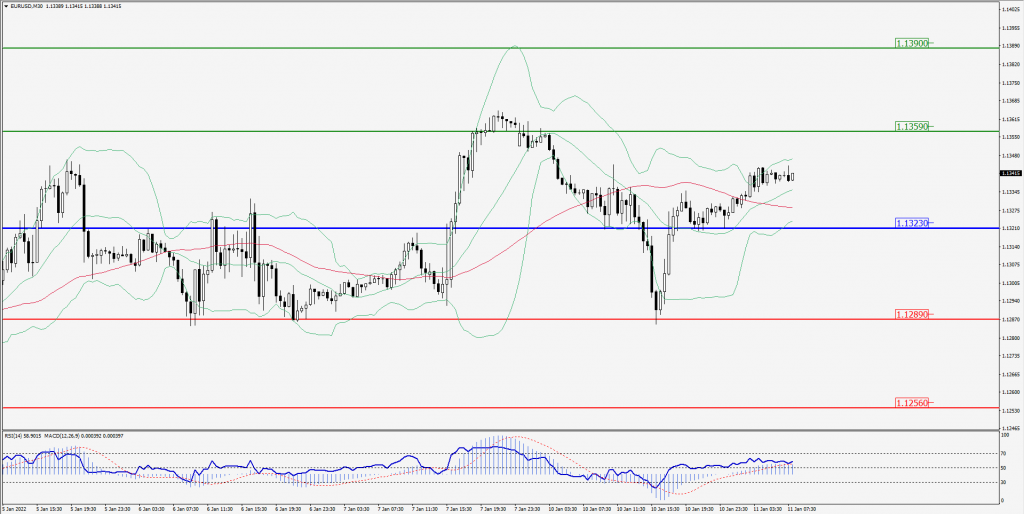
Green Lines Indicate Resistance Levels – Red Lines Indicates Support Levels
Light Blue is a Pivot Point – Black represents the price when the report was produced
GBP/USD Intraday: Major Support at 1.35760
Our pivot point is at 1.35760
Preferable Price Action: Buy positions Above pivot with targets at 1.36230 & 1.36690 in extension.
Alternative Price Action: The price Below pivot would call for further Downside to 1.35300 & 1.34830.
Comment: Pair Above its 20MA & 55MA and RSI above 50 levels.
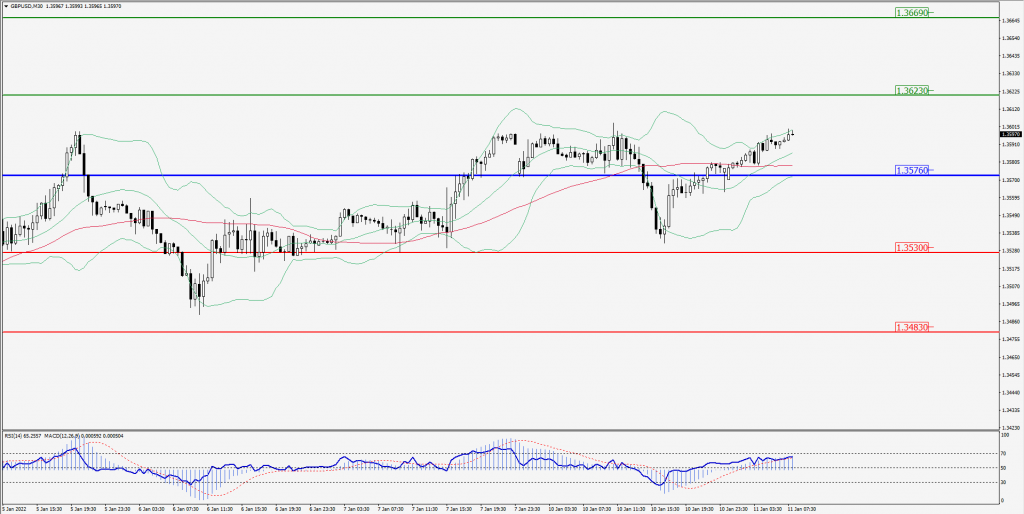
Green Lines Indicate Resistance Levels – Red Lines Indicates Support Levels
Light Blue is a Pivot Point – Black represents the price when the report was produced
USD/JPY Intraday: Trend on the major Downside
Our pivot point is at 115.430
Preferable Price Action: Sell position Below pivot with the target at 115.030 and 114.630 in extension.
Alternative Price Action: The Upside breakout of the pivot would call for 115.830 and 116.230.
Comment: Pair Below 55MA and MACD in Negative territory.
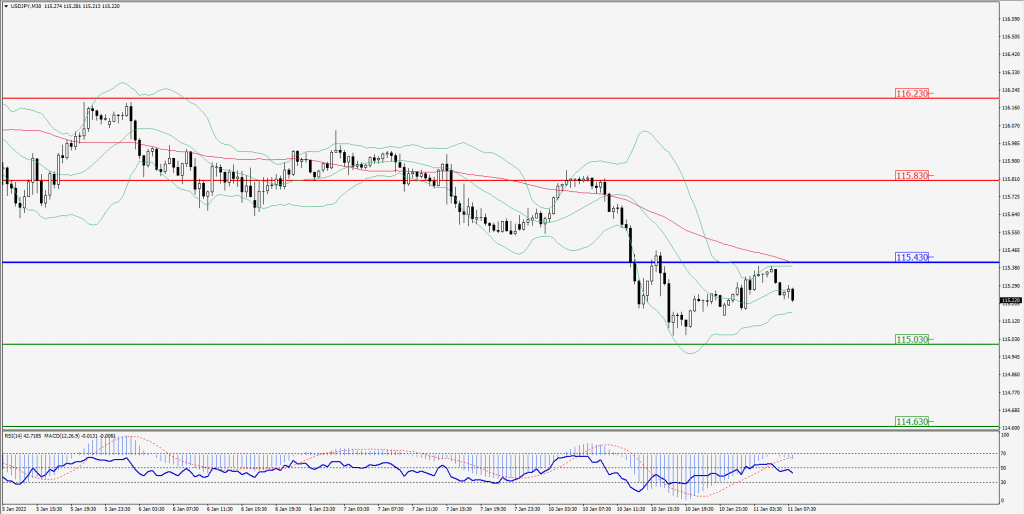
Green Lines Indicate Resistance Levels – Red Lines Indicates Support Levels
Light Blue is a Pivot Point – Black represents the price when the report was produced
AUD/USD Intraday: Major Support at 0.71560
Our pivot point is at 0.71560
Preferable Price Action: Buy Positions Above pivot with targets at 0.72230 & 0.72900 in extension.
Alternative Price Action: Below pivot looks for a further Downside with 0.70900 & 0.70330 as targets.
Comment: Pair above its 20MA & 55MA and RSI above 50 levels.
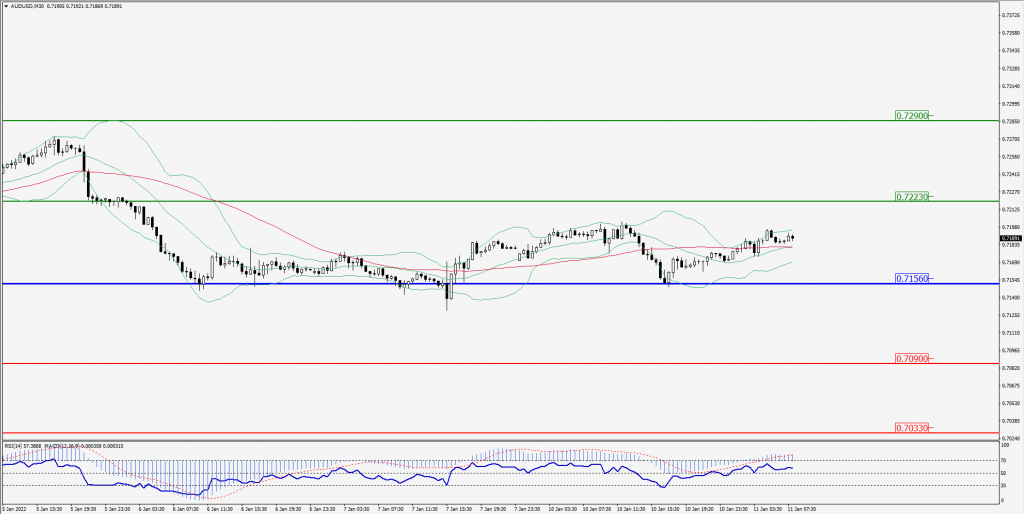
Green Lines Indicate Resistance Levels – Red Lines Indicates Support Levels
Light Blue is a Pivot Point – Black represents the price when the report was produced
CRUDEOIL Intraday: In a Consolidation Zone
Our pivot point is at 77.30
Preferable Price Action: Above pivots Buy Oil with 79.30 & 81.30 as targets.
Alternative Price Action: Sell crude Below pivot with targets at 75.30 and 73.30 in extension.
Comment: Price Above 20MA and MACD is in the positive territory.
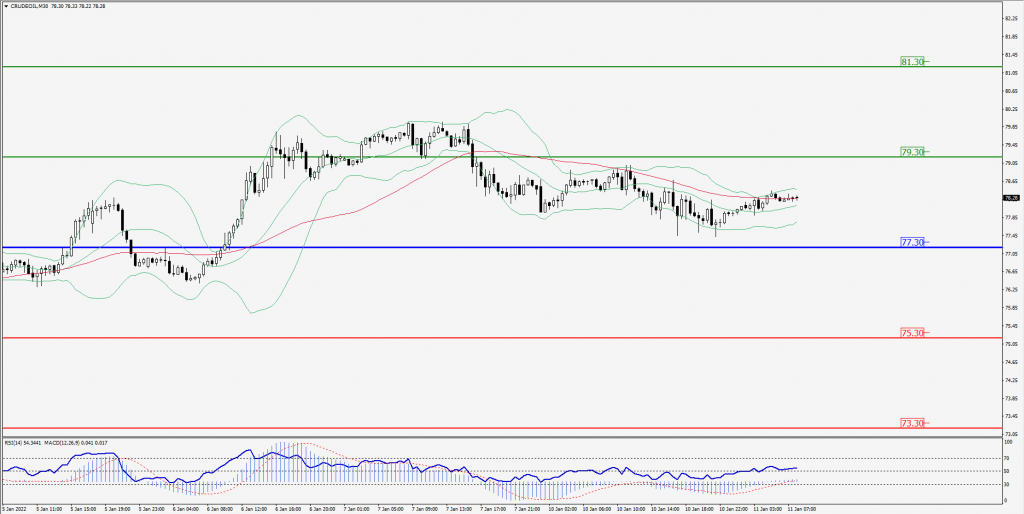
Green Lines Indicate Resistance Levels – Red Lines Indicates Support Levels
Light Blue is a Pivot Point – Black represents the price when the report was produced
XAU/USD Intraday: In Consolidation Zone
Our pivot point is 1803.00
Preferable Price Action: Further Upside to 1818.00 and 1833.00.
Alternative Price Action: If the price gives a Downside breakout of a pivot, then the price extends to 1788.00 and 1773.00.
Comment: MACD is in positive territory and the price is above its 20MA & 55MA.
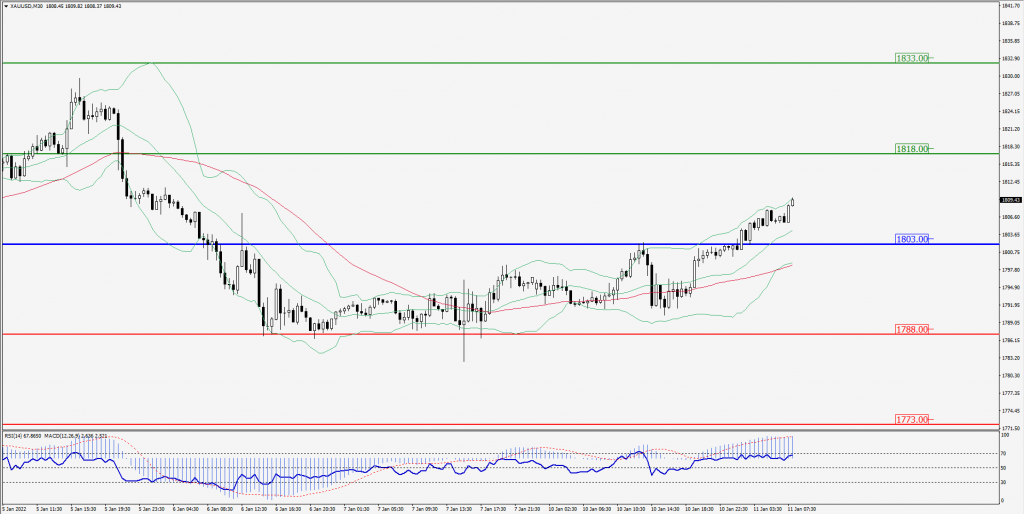
Green Lines Indicate Resistance Levels – Red Lines Indicates Support Levels
Light Blue is a Pivot Point – Black represents the price when the report was produced
Dow Jones Intraday: Trend on the Downside
Our pivot point is 36,200.00
Preferable Price Action: Take Short positions Below pivot with targets at 35,850.00 & 35,500.00.
Alternative Price Action: Above 36,200.00 looks for further Upside to 36,550.00 & 36,900.00.
Comment: RSI At 50 levels And price is Below 55MA.
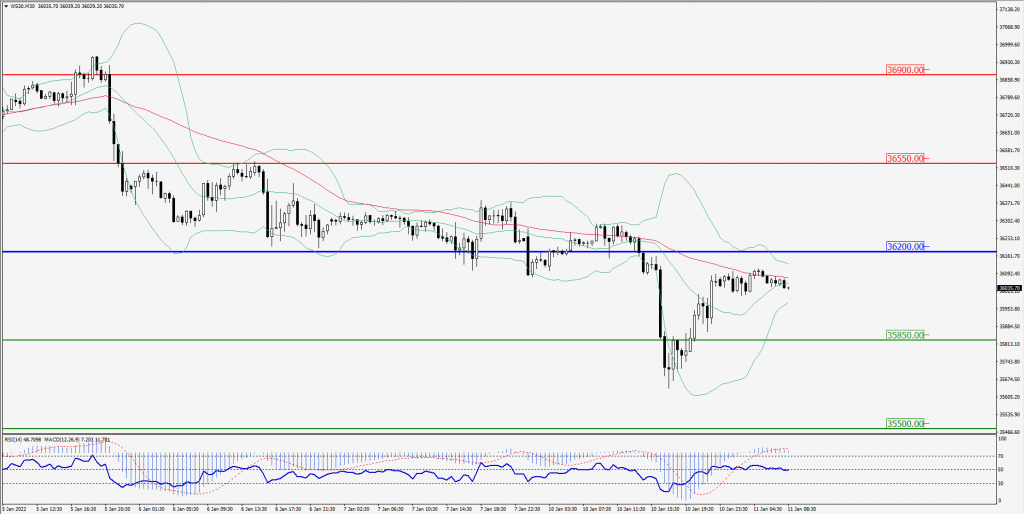
Green Lines Indicate Resistance Levels – Red Lines Indicates Support Levels
Light Blue is a Pivot Point – Black represents the price when the report was produced