Market Wrap: Stocks, Bonds, Commodities
The S&P 500 ended a volatile session close to unchanged on Friday as technology shares fell but financials lent support a day after the market sold off on a hawkish slant in Federal Reserve minutes.
The S&P 500 loose (0.10%) to end at 4,696.05 points, while the Nasdaq Composite lost 19.30 points (0.13%) to 15,080.90. The Dow Jones Industrial fall 170.64 points (0.47%) to 36,236.47.
MSCI’s index of Asia-Pacific stocks outside Japan rose 0.52%, to 782.99 levels. Australian index stair up 1.29% to 7,453.30. Japanese Nikkei Index down 0.03% to 28,478.56.
European stocks were negative on Friday, with the Stoxx Europe 50 Index left 0.06% to 4,322.25, Germany’s DAX stair down 0.27% to 16,009.31, and France’s CAC lost 0.12% to 7,241.24, and U.K.’s FTSE 100 gained 0.14% to 7,461.03.
Benchmark 10-year U.S. Treasury descend as demand for safe assets loos again, today 10-year bond yields fall 0.37% to 1.727.
Oil prices rose about 2% on Friday, extending their new year’s rally, on escalating unrest in OPEC+ oil producer Kazakhstan and supply outages in Libya.
Spot Brent crude oil collected 0.54% to $82.44 per barrel. US West Texas Intermediate crude up to $79.92 a barrel.
The yellow metal gold is flat to 1,789.40 dollars per ounce.
Market Wrap: Forex
The dollar is set to notch up a fifth consecutive weekly gain on the Japanese yen and looks poised to extend the rally if U.S. labour data due later on Friday reinforces the case for early Federal Reserve interest rate hikes.
Today, the U.S. dollar index measures the greenback against a trade-weighted basket of six major currencies, which is down 0.19% to 96.210.
The Euro US Dollar (EUR/USD) is a widely traded pair that is rising today. This left the pair trading around $1.13140.
The Japanese yen rise against the U.S. dollar on Friday as the stock pushes the upper. Today US/JPY is gained 0.06% to 115.890 level.
Another commodity-related currency mixed against the U.S dollar, AUD/USD dropped 0.06% to 0.71560, and NZD/USD rose 0.12% to 0.67530 level.
EUR/USD Intraday: Support at 1.12890
Our pivot point is at 1.12890
Preferable Price Action: Take Long positions above pivot level with targets at 1.13230 & 1.13490 in extension.
Alternative Price Action: Below pivot looks for a further Downside to 1.12560 & 1.12290.
Comment: Pair Above 20MA and RSI above 50 levels.
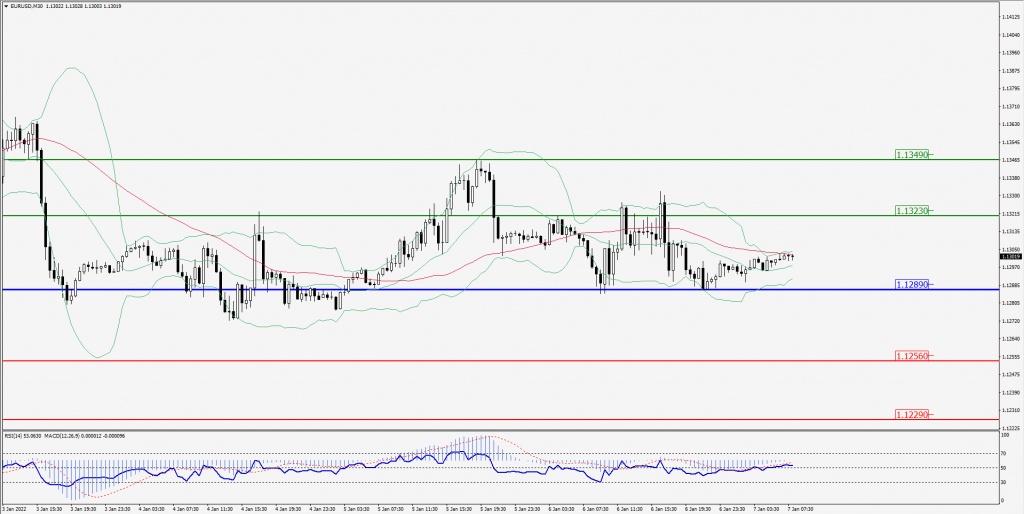
Green Lines Indicate Resistance Levels – Red Lines Indicates Support Levels
Light Blue is a Pivot Point – Black represents the price when the report was produced
GBP/USD Intraday: Major Support at 1.35290
Our pivot point is at 1.35290
Preferable Price Action: Buy positions Above pivot with targets at 1.35690 & 1.35990 in extension.
Alternative Price Action: The price Below pivot would call for further Downside to 1.34890 & 1.34590.
Comment: Pair Above its 20MA & 55MA and RSI above 50 levels.
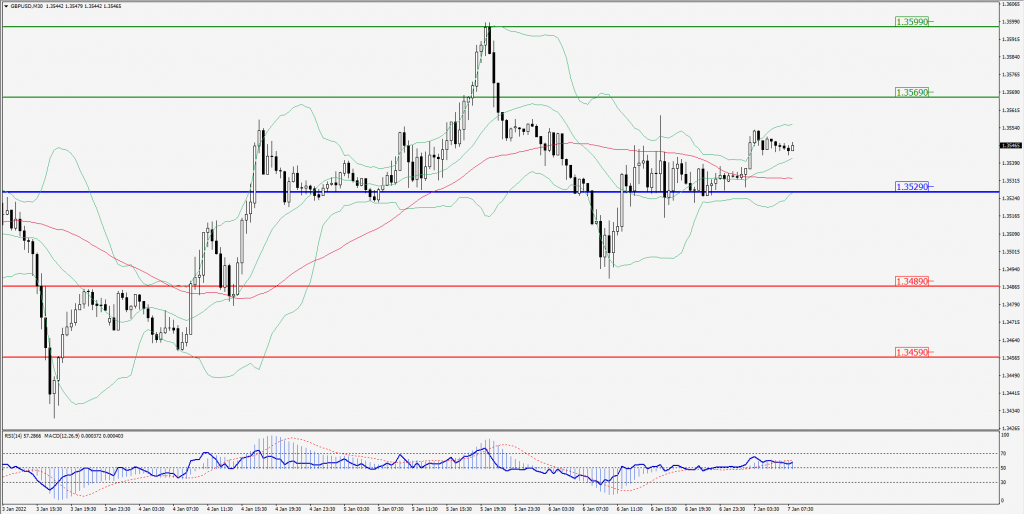
Green Lines Indicate Resistance Levels – Red Lines Indicates Support Levels
Light Blue is a Pivot Point – Black represents the price when the report was produced
USD/JPY Intraday: In a Consolidation Zone
Our pivot point is at 115.700
Preferable Price Action: Buy position Above pivot with the target at 116.200 and 116.590 in extension.
Alternative Price Action: The Downside breakout of the pivot would call for 115.200 and 114.830.
Comment: Price above 55MA and MACD in positive territory.
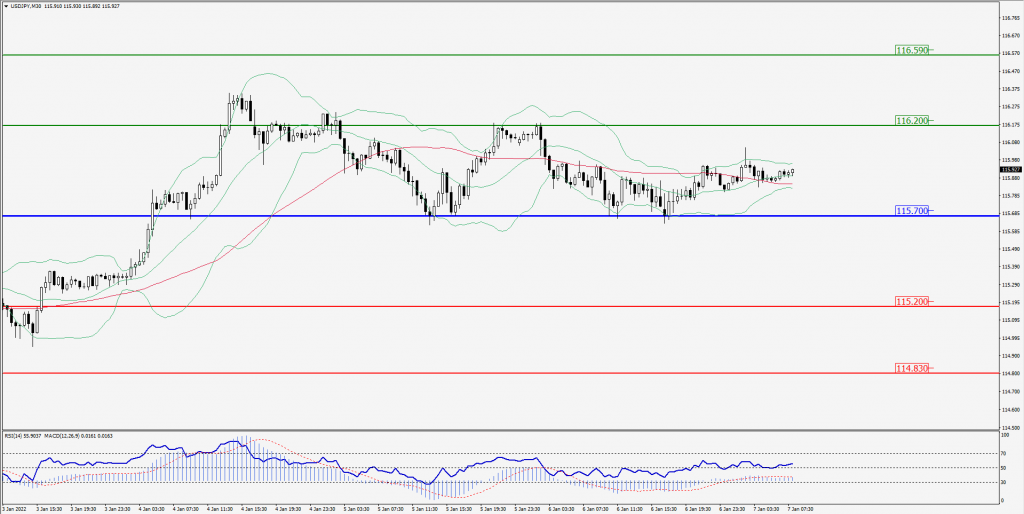
Green Lines Indicate Resistance Levels – Red Lines Indicates Support Levels
Light Blue is a Pivot Point – Black represents the price when the report was produced
AUD/USD Intraday: Trend on the downside
Our pivot point is at 0.71830
Preferable Price Action: Sell Positions Below pivot with targets at 0.71460 & 0.71160 in extension.
Alternative Price Action: Above pivot looks for a further Upside with 0.72200 & 0.72500 as targets.
Comment: Pair below its 20MA & 55MA and RSI below 50 levels.
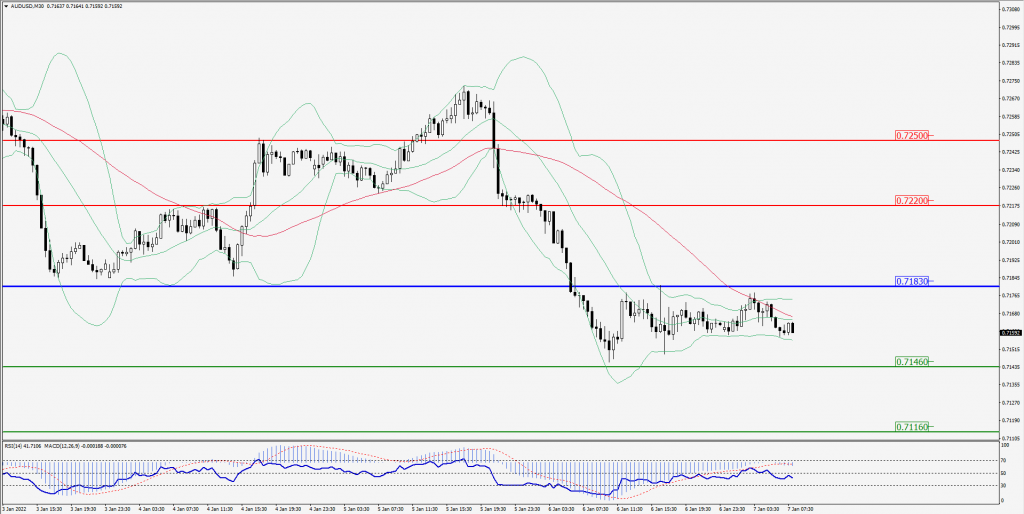
Green Lines Indicate Resistance Levels – Red Lines Indicates Support Levels
Light Blue is a Pivot Point – Black represents the price when the report was produced
CRUDEOIL Intraday: Support at 78.90
Our pivot point is at 78.90
Preferable Price Action: Above pivots Buy Oil with 80.60 & 81.90 as targets.
Alternative Price Action: Sell crude Below pivot with targets at 77.30 and 75.90 in extension.
Comment: Price Above 20MA & 55MA and MACD is in the positive territory.
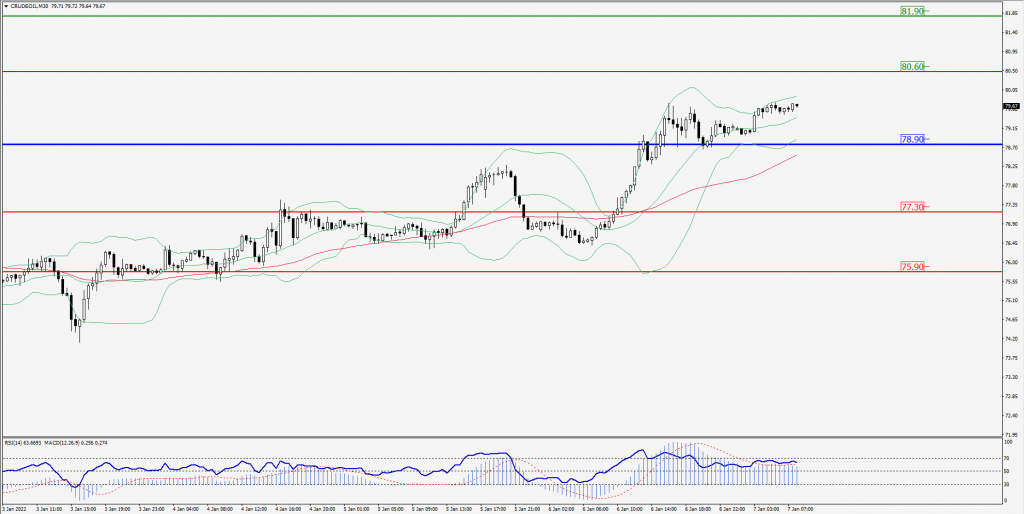
Green Lines Indicate Resistance Levels – Red Lines Indicates Support Levels
Light Blue is a Pivot Point – Black represents the price when the report was produced
XAU/USD Intraday: Major Down Trend
Our pivot point is 1796.90
Preferable Price Action: Further Downside to 1783.00 and 1773.00.
Alternative Price Action: If the price gives an Upside breakout of a pivot, then the price extends to 1810.80 and 1820.80.
Comment: MACD is in negative territory and the price is below its 55MA & 20MA.
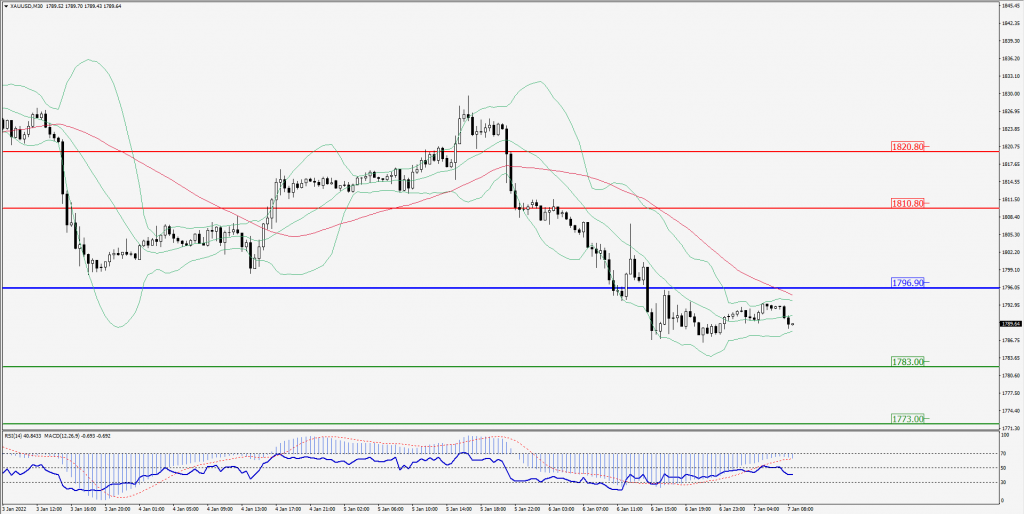
Green Lines Indicate Resistance Levels – Red Lines Indicates Support Levels
Light Blue is a Pivot Point – Black represents the price when the report was produced
Dow Jones Intraday: Trend on the major Downside
Our pivot point is 36,490.00
Preferable Price Action: Take Short positions Below pivot with targets at 36,190.00 & 35,960.00.
Alternative Price Action: Above 36,490.00 looks for further Upside to 36,790.00 & 37,020.00.
Comment: RSI at 50 levels And price is below 55MA.
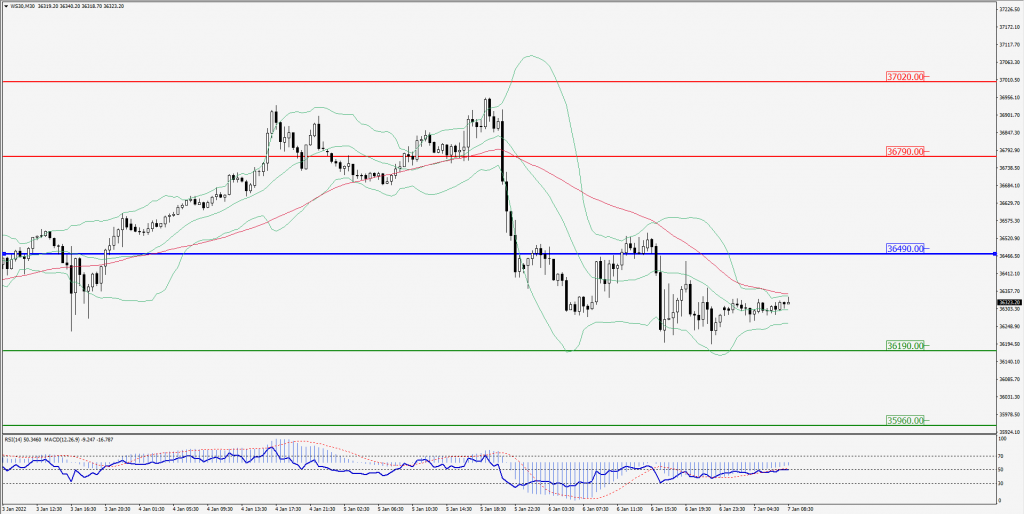
Green Lines Indicate Resistance Levels – Red Lines Indicates Support Levels
Light Blue is a Pivot Point – Black represents the price when the report was produced