Market Wrap: Stocks, Bonds, Commodities
Wall Street closed slightly higher on Wednesday with the three major indexes managing their third straight day of gains after test data showed the COVID-19 vaccine from Pfizer and BioNTech offered some protection against the new Omicron variant.
The Dow Jones Industrial Average rose 35.32 points (0.10%) to 35,754.75, the S&P 500 gained 14.46 points (0.31%) to 4,701.21 and the Nasdaq Composite added 100.07 points (0.64%) to 15,786.99.
MSCI’s index of Asia-Pacific stocks outside Japan rose 0.83% to 803.88 levels. Australian index slipped 0.28% to 7,384.50. Japanese Nikkei Index fell 0.47% to 28,725.47.
European stocks were higher on Thursday, with the Stoxx Europe 50 Index rose 0.21% to 4,241.75, Germany’s DAX gained 0.16% to 15,713.43, and France’s CAC advances 0.28% to 7,033.42, and U.K.’s FTSE 100 rose 0.28% to 7,358.86.
Benchmark 10-year U.S. Treasury rose as demand for safe assets grows again, today 10-year bond yields fell 0.35% to 1.504.
Oil prices ended higher in a back-and-forth session on Wednesday, maintaining a positive tone as investors no longer expect the Omicron coronavirus variant to derail global economic growth.
Spot Brent crude oil advance 0.33% to $76.13 per barrel. US West Texas Intermediate crude gained 0.57% to $72.77 a barrel.
The yellow metal gold is flat to 1785.75 dollars per ounce.
Market Wrap: Forex
This week’s rally in risk-friendly assets and currencies like the Australian dollar petered out on Thursday, but the U.S. dollar struggled to regain its lost ground as investors waited for a key Federal Reserve policy meeting due next week.
Today, the U.S. dollar index measures the greenback against a trade-weighted basket of six major currencies, which rose 0.12% to 95.998.
The Euro US Dollar (EUR/USD) is a widely traded pair that is falling 0.20% today. This left the pairing trading around $1.13190.
The Japanese yen rose against the U.S. dollar on Thursday as the stock pushes higher. Today US/JPY is rose 0.11% to 113.520 level.
Another commodity-related currency higher against the U.S dollar, AUD/USD rose 0.10% to 0.71760, and NZD/USD gained 0.18% to 0.67180 level.
EUR/USD Intraday: Support at 1.13100
Our pivot point is at 1.13100
Preferable Price Action: Take Long positions Above pivot level with targets at 1.13530 & 1.13760 in extension.
Alternative Price Action: Below pivot looks for a further Downside to 1.12660 & 1.12460.
Comment: Pair above its 55MA and RSI above 50 levels.
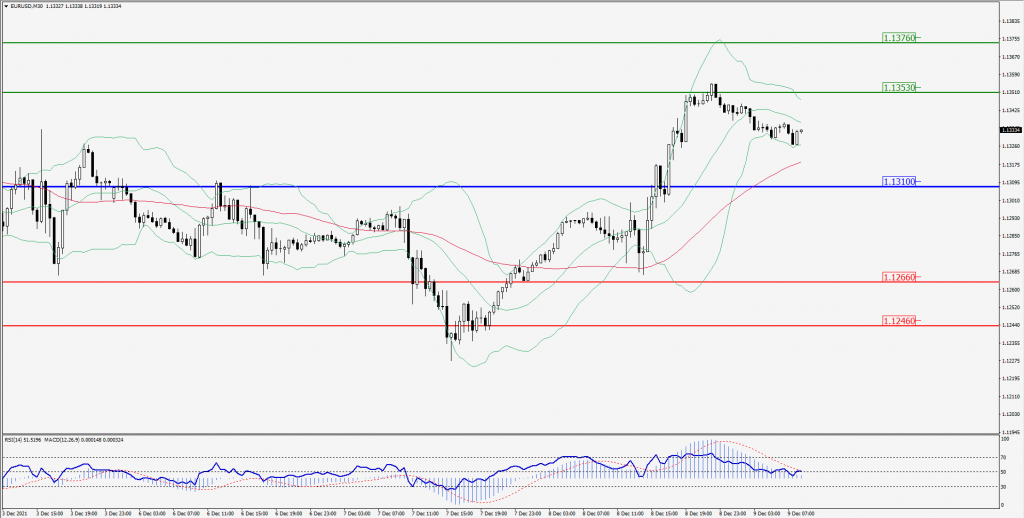
Green Lines Indicate Resistance Levels – Red Lines Indicates Support Levels
Light Blue is a Pivot Point – Black represents the price when the report was produced
GBP/USD Intraday: Resistance at 1.32400
Our pivot point is at 1.32400
Preferable Price Action: Sell positions below pivot with targets at 1.31960 & 1.31730 in extension.
Alternative Price Action: The price above pivot would call for further upside to 1.32860 & 1.33060.
Comment: Pair below its 55MA & 20MA and RSI at 50 levels.
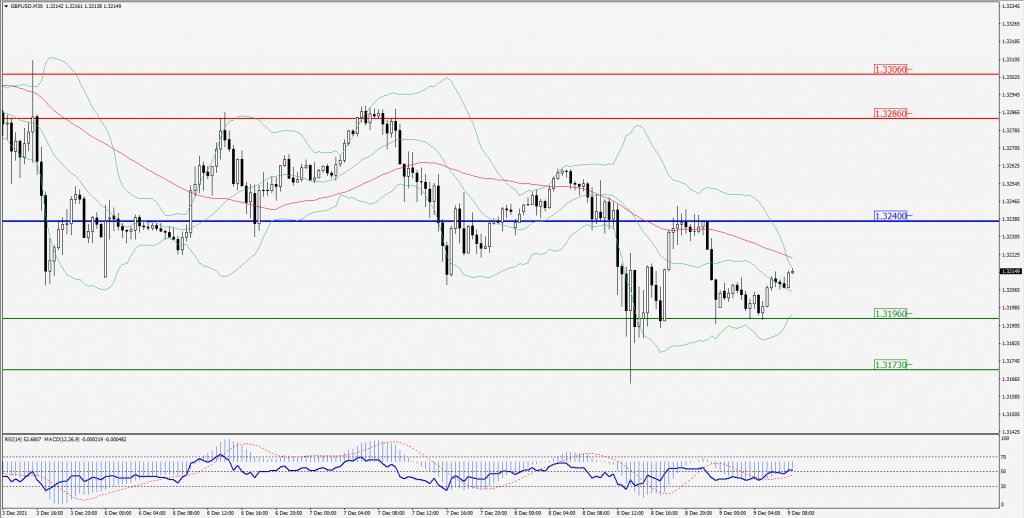
Green Lines Indicate Resistance Levels – Red Lines Indicates Support Levels
Light Blue is a Pivot Point – Black represents the price when the report was produced
USD/JPY Intraday: Trend on the upside
Our pivot point is at 113.390
Preferable Price Action: Buy position Above pivot with the target at 113.960 and 114.160 in extension.
Alternative Price Action: The Downside breakout of the pivot would call for 112.890 and 112.690.
Comment: Price below its 20MA and MACD in positive territory.
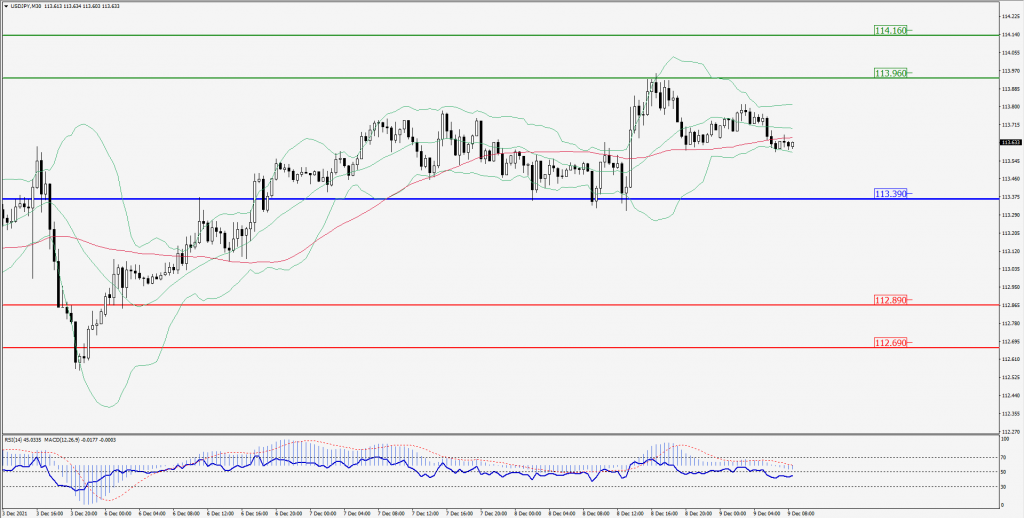
Green Lines Indicate Resistance Levels – Red Lines Indicates Support Levels
Light Blue is a Pivot Point – Black represents the price when the report was produced
AUD/USD Intraday: Strong trend on the upside
Our pivot point is at 0.71430
Preferable Price Action: Buy Positions above pivot with targets at 0.71990 & 0.72260 in extension.
Alternative Price Action: Below pivot looks for a further downside with 0.70860 & 0.70560 as targets.
Comment: Pair above its 55MA & 20MA and RSI above 50 levels.
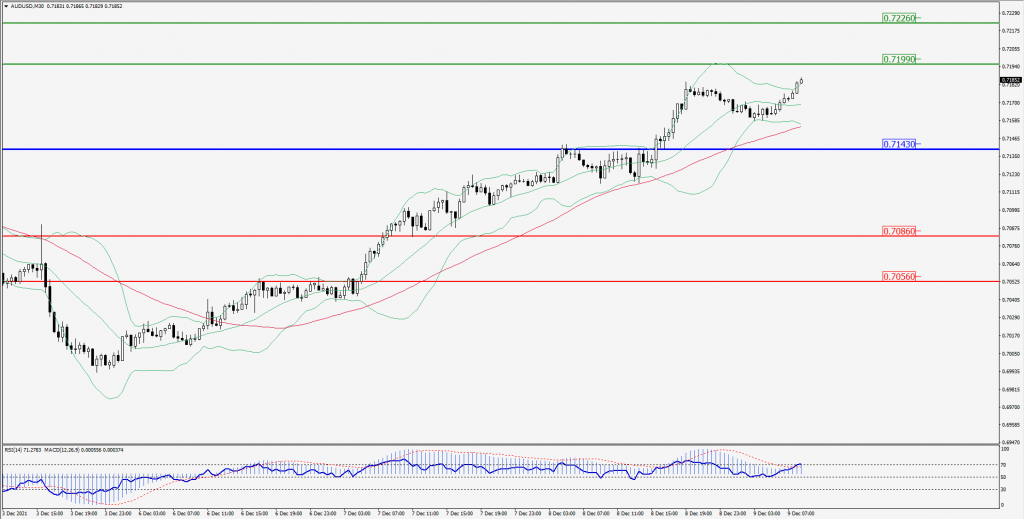
Green Lines Indicate Resistance Levels – Red Lines Indicates Support Levels
Light Blue is a Pivot Point – Black represents the price when the report was produced
CRUDEOIL Intraday: Trend on the upside
Our pivot point is at 70.60
Preferable Price Action: Above pivots Buy Oil with 74.60 & 76.30 as targets.
Alternative Price Action: Sell crude Below pivot with targets at 67.30 and 65.30 in extension.
Comment: Crude is above its 20MA & 55MA and MACD in the positive territory.
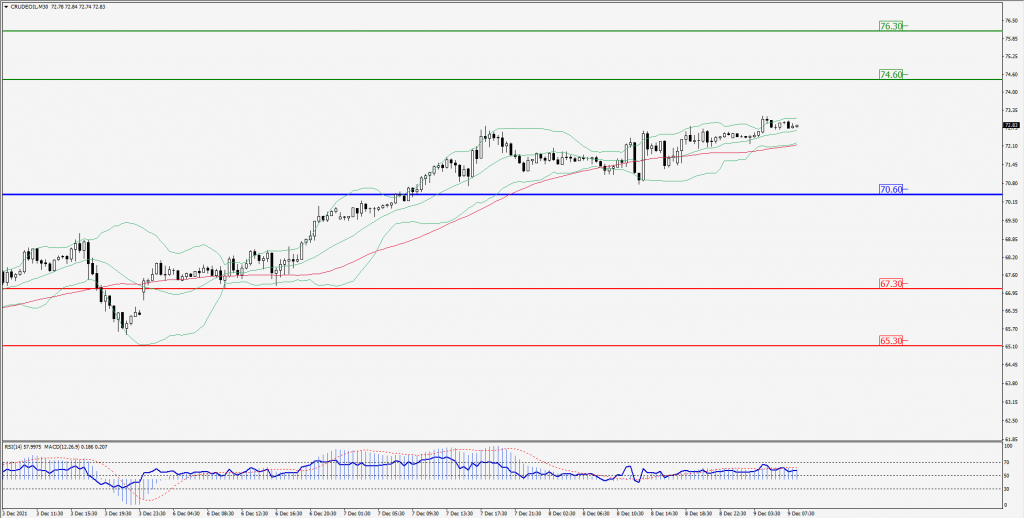
Green Lines Indicate Resistance Levels – Red Lines Indicates Support Levels
Light Blue is a Pivot Point – Black represents the price when the report was produced
XAU/USD Intraday: Support at 1780.30
Our pivot point is 1780.30
Preferable Price Action: Further upside to 1794.30 and 1801.30.
Alternative Price Action: If the price gives a downside breakout of a pivot, then the price extends to 1767.90 and 1762.30.
Comment: MACD in positive territory and price above its 20MA & 55MA.
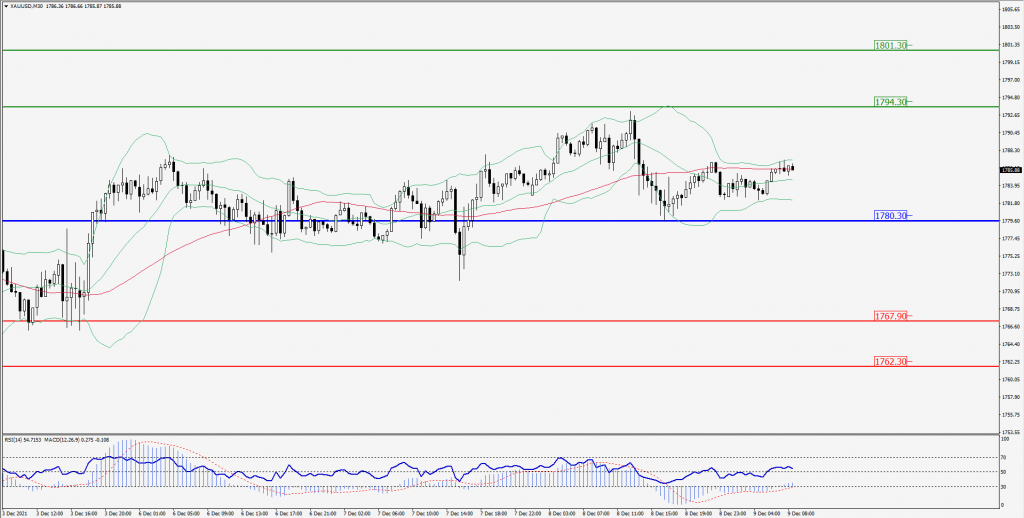
Green Lines Indicate Resistance Levels – Red Lines Indicates Support Levels
Light Blue is a Pivot Point – Black represents the price when the report was produced
Dow Jones Intraday: Trend on the upside
Our pivot point is 35,490.00
Preferable Price Action: Take Long positions above pivot with targets at 35,960.00 & 36,196.00.
Alternative Price Action: Below 35,490.00 looks for further Downside to 35,060.00 & 34,800.00.
Comment: Price above its 55MA & 20MA and RSI above 50 levels.
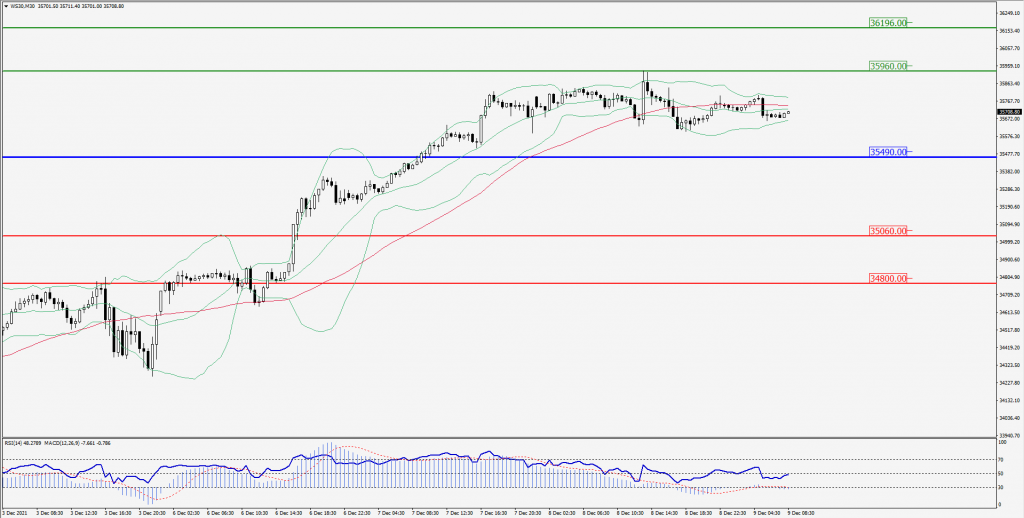
Green Lines Indicate Resistance Levels – Red Lines Indicates Support Levels
Light Blue is a Pivot Point – Black represents the price when the report was produced