Market Wrap: Stocks, Bonds, Commodities
An error by S&P Dow Jones Indices may have contributed to volatility in shares of Morgan Stanley, Pfizer , PNC Financial Services Group and other stocks in recent days, traders said.
The Dow Jones Industrial Average rose 130.30 points to 38,791.35, the S&P 500 gain 1.03% to 5,157.36 and the Nasdaq Composite add 241.83 points to 16,273.38.
MSCI’s index of Asia-Pacific stocks outside Japan is advance 1.06% to 653.54 levels. The Australian index was higher by 1.07% to 7,847.00. Japanese Nikkei Index drop 0.25% today.
European stocks were mixed on Friday, with the Stoxx Europe 50 Index rose 0.21% to 4,984.25, Germany’s DAX drop 0.22% to 17,830.65, and France’s CAC decline 0.16% to 8029.77 and U.K.’s FTSE 100 subtract 0.20% to 7,676.81.
Benchmark 10-year U.S. Treasury fell as demand for safe assets ascend again, today 10-year bond yields negative 0.39% to 4.076.
Oil prices rose on Friday, driven by growing demand in the United States and China, the world’s biggest oil consumers, and as the U.S. Federal Reserve gave a positive signal on possibility of rate cuts.
Spot Brent crude oil drop 0.57% to $83.39 per barrel. US West Texas Intermediate crude is up 0.65% to $79.41 a barrel.
The yellow metal gold is advance 0.48% to 2,175.65 dollars per ounce.
Market Wrap: Forex
The U.S. dollar edged higher in early European trade Friday, but was still on course for a hefty weekly drop as Federal Reserve Chair Jerome Powell signaled lower interest rates in coming months, while the euro slipped back from recent highs after the European Central Bank meeting.
Today, the U.S. dollar index measures the Greenback against a trade-weighted basket of six major currencies, which slipped 0.07% to 102.695.
The Euro US Dollar (EUR/USD) is a widely traded pair that is down 0.09% today. This left the pair trading around $1.09360.
The Japanese yen was negative against the U.S. dollar on Friday. Today USD/JPY is slipped 0.70% to the 147.060 level.
Another commodity-related currency positive against the U.S dollar, AUD/USD rose 0.44% to 0.66450, and NZD/USD surged 0.23% to 0.61870 level.
EUR/USD Intraday: Trend on the upside
Our pivot point is at 1.09440
Preferable Price Action: Take buy positions above pivot level with targets at 1.09620 & 1.09750 in extension.
Alternative Price Action: Below pivot looks for a further downside to 1.09260 & 1.09120.
Comment: RSI is above 50 levels and Pairs above 55MA.
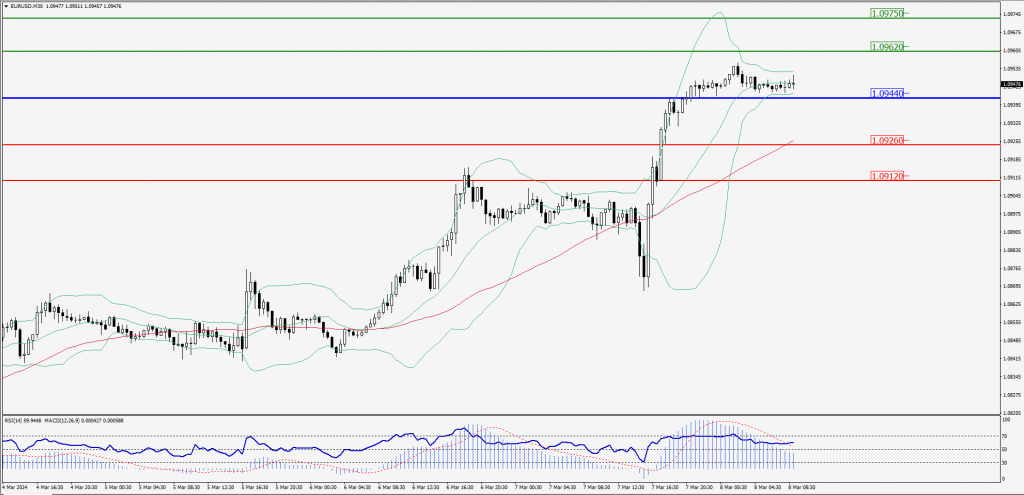
Green Lines Indicate Resistance Levels – Red Lines Indicate Support Levels
Light Blue is a Pivot Point – Black represents the price when the report was produced
GBP/USD Intraday: Trend on the upside
Our pivot point is at 1.28010
Preferable Price Action: Buy positions above pivot with targets at 1.28240 & 1.28410 in extension.
Alternative Price Action: The price below pivot would call for further downside to 1.27770 & 1.27600.
Comment: RSI is above 50 levels and Pairs above 55MA.
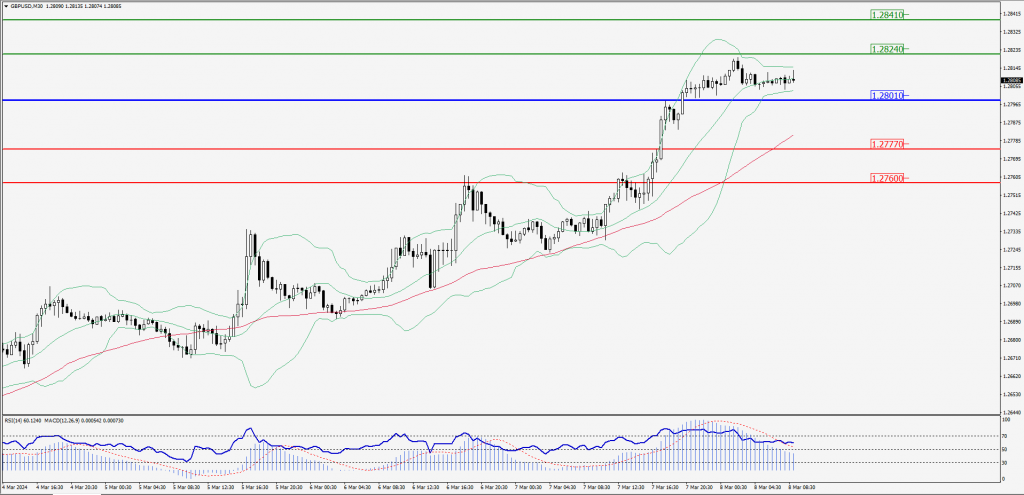
Green Lines Indicate Resistance Levels – Red Lines Indicate Support Levels
Light Blue is a Pivot Point – Black represents the price when the report was produced
USD/JPY Intraday: Support level at 147.900
Our pivot point is at 147.900
Preferable Price Action: Buy position above pivot with the target at 148.410 and 148.820 in extension.
Alternative Price Action: The downside breakout of the pivot would call for 147.310 and 146.910.
Comment: MACD is above 50 level.
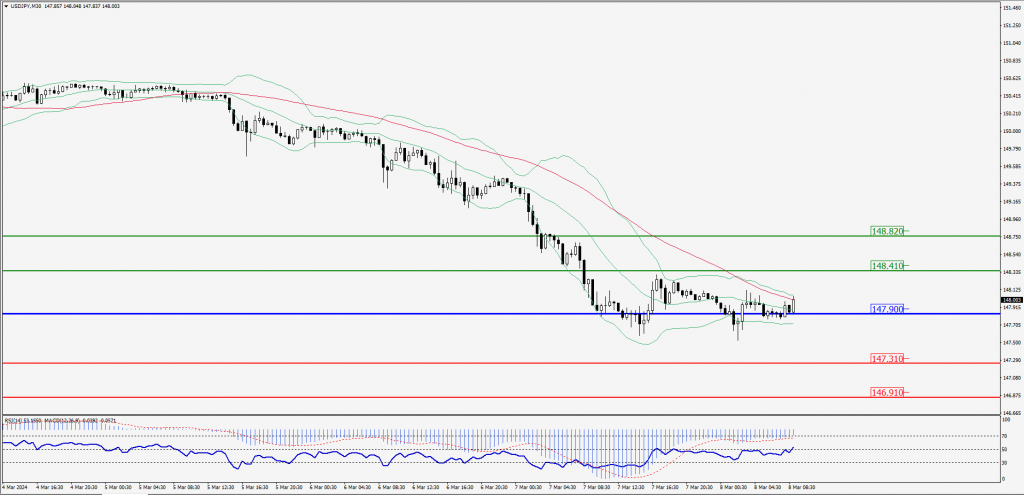
Green Lines Indicate Resistance Levels – Red Lines Indicate Support Levels
Light Blue is a Pivot Point – Black represents the price when the report was produced
AUD/USD Intraday: Trend on the upside
Our pivot point is at 0.66200
Preferable Price Action: Buy positions above pivot with targets at 0.66440 & 0.66620 in extension.
Alternative Price Action: Below pivot looks for a further downside with 0.65970 & 0.65790 as targets.
Comment: RSI is above 50 levels and Pairs above its 20MA & 55MA.
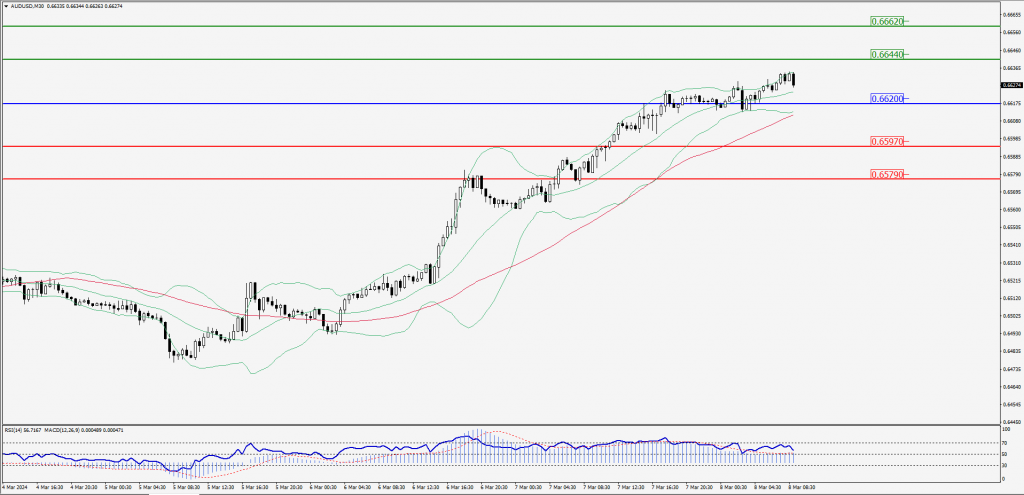
Green Lines Indicate Resistance Levels – Red Lines Indicate Support Levels
Light Blue is a Pivot Point – Black represents the price when the report was produced
CRUDEOIL Intraday: Trend on the upside
Our pivot point is at 78.98
Preferable Price Action: Above pivot buy oil with 79.41 & 79.70 as targets.
Alternative Price Action: Sell crude below pivot with targets at 78.60 and 78.28 in extension.
Comment: MACD is positive territory and Pairs above its 20MA & 55MA.
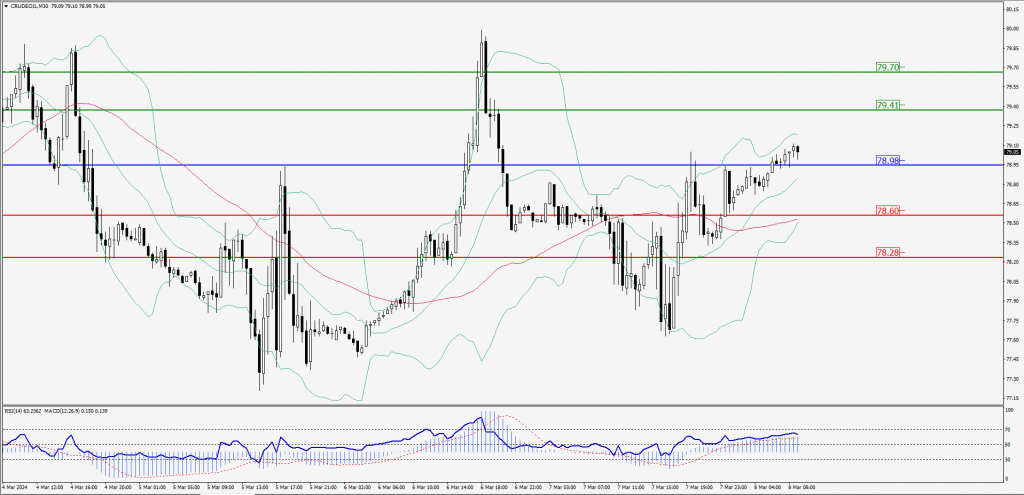
Green Lines Indicate Resistance Levels – Red Lines Indicate Support Levels
Light Blue is a Pivot Point – Black represents the price when the report was produced
XAU/USD Intraday: Major support level at 2155.50
Our pivot point is 2155.50
Preferable Price Action: Further upside to 2172.70 and 2184.70.
Alternative Price Action: If the price gives a downside breakout of a pivot, then the price extends to 2139.00 and 2125.70.
Comment: MACD is above 50 level and Pairs above 55MA.
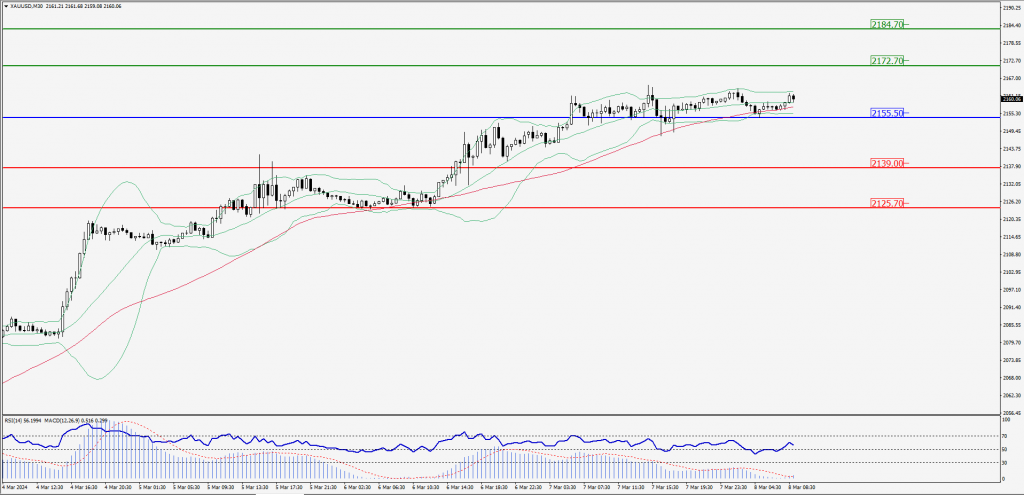
Green Lines Indicate Resistance Levels – Red Lines Indicate Support Levels
Light Blue is a Pivot Point – Black represents the price when the report was produced
Dow Jones Intraday: Resistance level at 38,792.00
Our pivot point is 38,792.00
Preferable Price Action: Take sell positions below the pivot with targets at 38,696.60 & 38,627.90.
Alternative Price Action: Above 38,792.00 looks for further upside to 38,885.00 & 38,960.10.
Comment: RSI is below 50 levels and Pairs below 20MA .
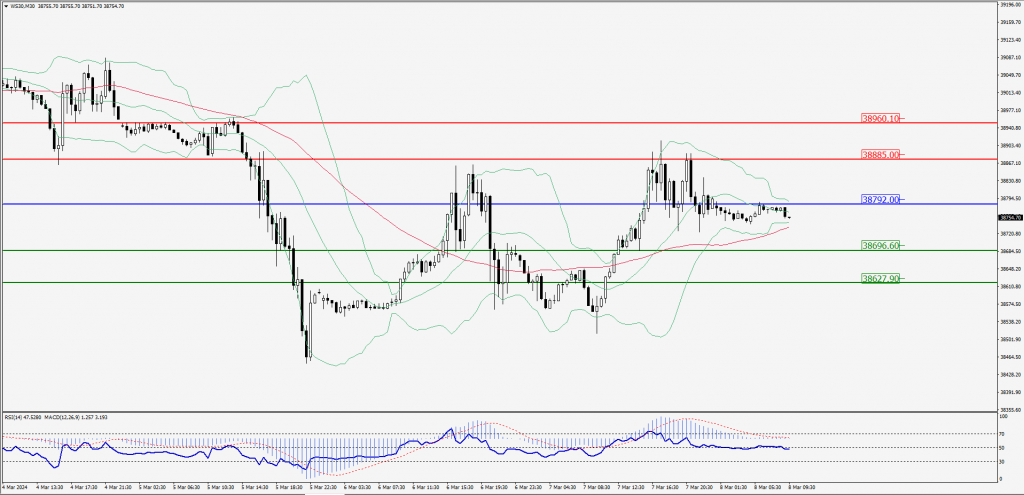
Green Lines Indicate Resistance Levels – Red Lines Indicate Support Levels
Light Blue is a Pivot Point – Black represents the price when the report was produced